SmartTag
With the AT Internet integration, you can access deep insights into your campaigns (A/B tests or Personalizations) directly within the AT Internet (SmartTag or Xiti) interface.
Key benefits:
- Analyze the impact of A/B tests and personalizations on the entire customer journey.
- Uncover new opportunities about your campaigns using AT Internet's analytics capabilities.
Activate AT Internet SmartTag on Kameleoon
Integrations page
To use SmartTag, the first step is to activate “AT Internet – SmartTag” in the Integrations page. To set up SmartTag in the Integrations page:
- Log in to your Kameleoon app
- Click Admin > Integrations.
- Add the tool under the name AT Internet - SmartTag.
- Click Install the tool.
- Select the projects on which you want to activate the tool.
- Indicate the SmartTag variables you are using for your projects.
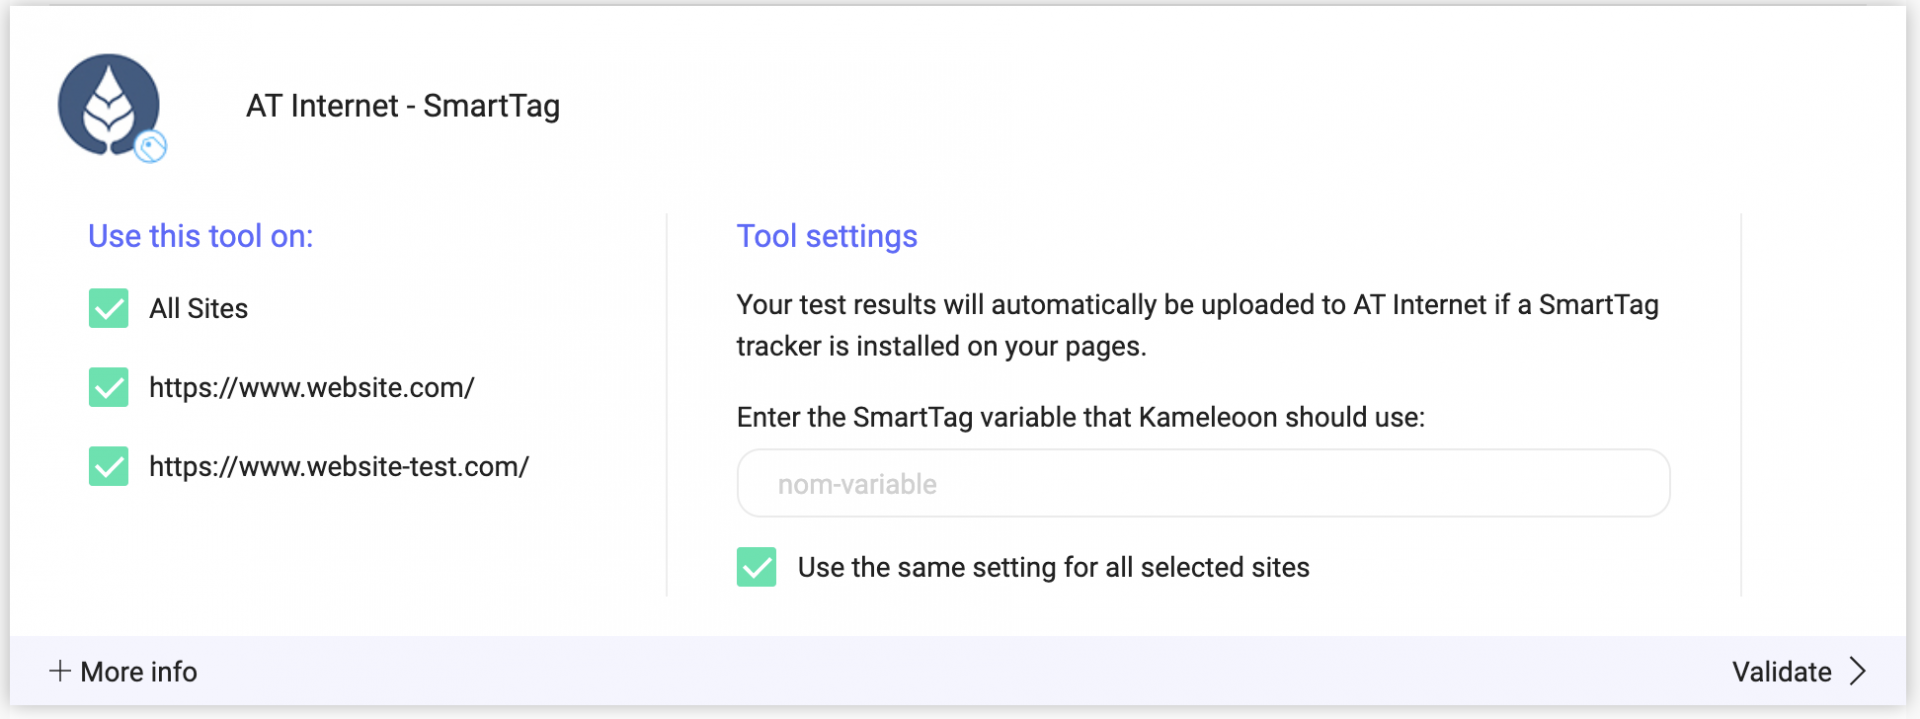
You also need to activate the MV Testing option in your SmartTag.
When selecting a project, you are asked to select a tracking variable.
If you select more than one project, the option Use the same setting for all selected projects appears. By default, the box is checked.
If you leave it checked, the same tracking variable will be used for all projects.
If you uncheck the box, you can switch between all selected projects in the drop-down list at the top. You will have to give a variable to each selected project.
Once you have configured the tool and click Validate. The configuration panel closes. You will see an ON toggle on the right of the tool’s line and the number of projects the tool is configured on.

Please note that if you need to change the behavior of our native bridge, you can create a custom analytics bridge and use our AT Internet sample code you can take from our Github repository.
Graphic editor
Once AT Internet – SmartTag has been activated in a project's Integrations page, it will be displayed in the Integrations section of the Graphic editor.
If you want to select SmartTag for an experiment, click the toggle.
Once AT Internet – SmartTag is added, it is displayed in the Experiment summary pop-in.
Results page
Once AT Internet – SmartTag has been chosen as a tracking tool for an experiment, it appears in the Reporting tools list on the right side of the experiment results page.
Click Edit to display a pop-in where you can manage the tools used for the experiment. AT Internet – SmartTag should appear on this list.
Personalization creation page
Once AT Internet – SmartTag has been activated in the Integrations page, it will be displayed in the Reporting tools list when creating a personalization
Feature flag
Learn how to manage third-party analytics integrations
Analyze your results in AT internet
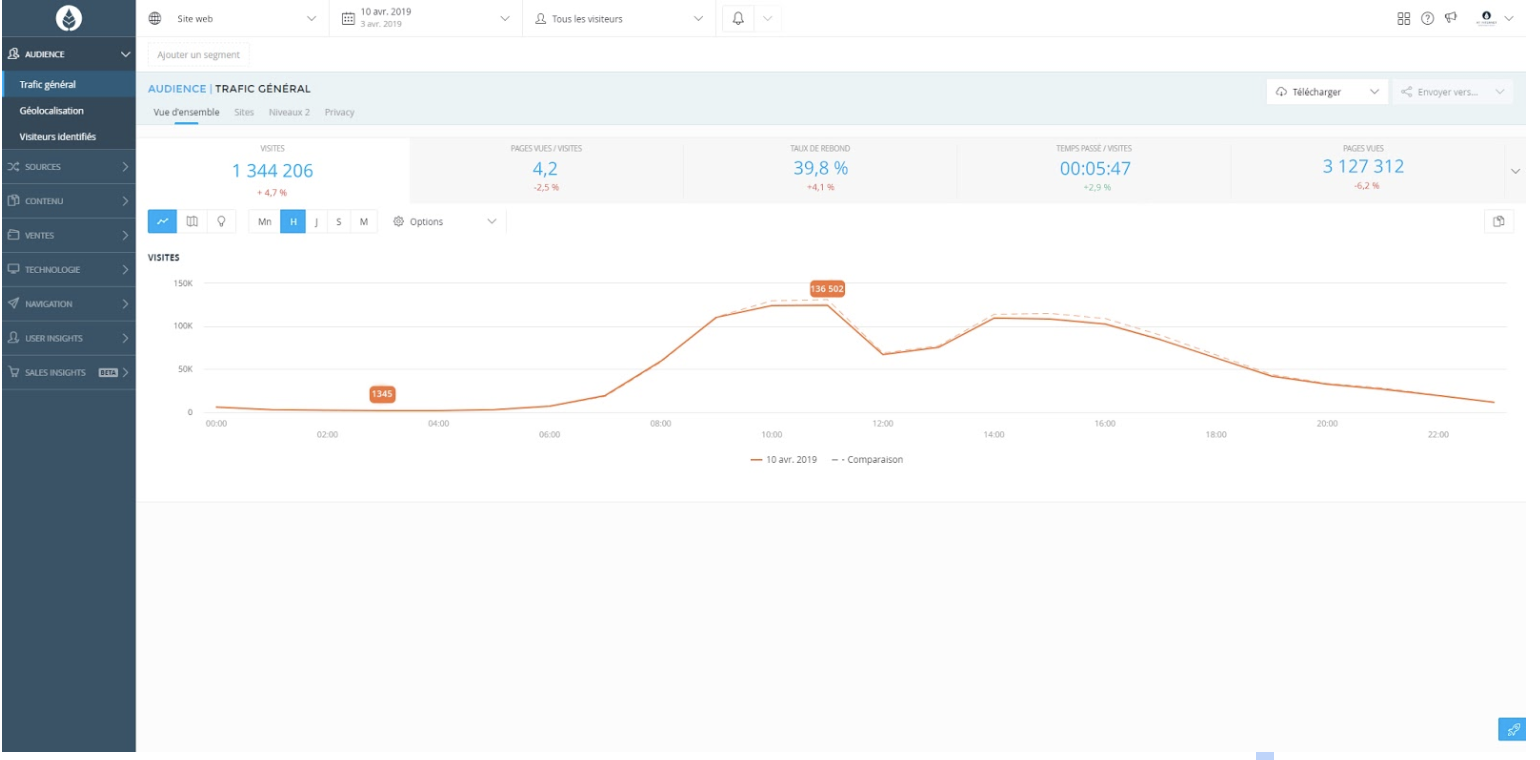
On the SmartTag dashboard landing page, you'll find general information about your audience.
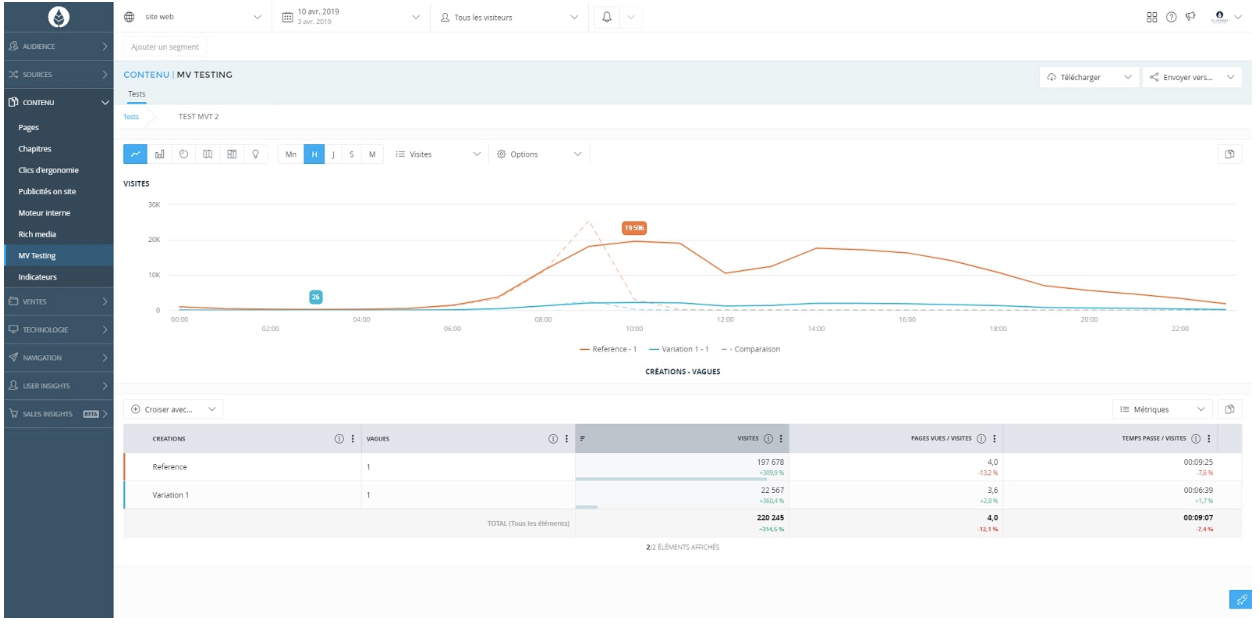
To access your experiments’ results analysis, click Content > MV Testing.
The list of your experiments appears in the table at the bottom of the page. On the graph above, the curves represent the selected experiments’ results evolution.
Clicking the arrow to the left of the experiment title displays a diagram showing the number of visits generated on the reference and the tested variations of the page.
By clicking on the experiment name, you can display the detailed results.