
In this article:
– How to define the goals and metrics for your experiment
– How to create variations of your website pages using Kameleoon’s Graphic editor or Code editor
– How to define the experiment settings, such as targeting options and traffic distribution
– How to launch and monitor your experiment
– How to analyze and interpret the results of your experiment using Kameleoon’s reporting tools (and best practices for ensuring the accuracy and reliability of your results)
Access the finalization page
Once your variations are created, you are ready for the last step: launching your graphic A/B experiment!
On the right of the header, you will find the Finalize button.

It opens the finalization page where you can complete the steps before launching your experiment:

- Define targeting
- Allocate traffic to variations
- Define goals (mandatory unless you configure Integrations)
- Associate integrations (mandatory unless you configure Goals)
- Simulate your experiment (optional)
On the finalization page, you can also:
Define the targeting
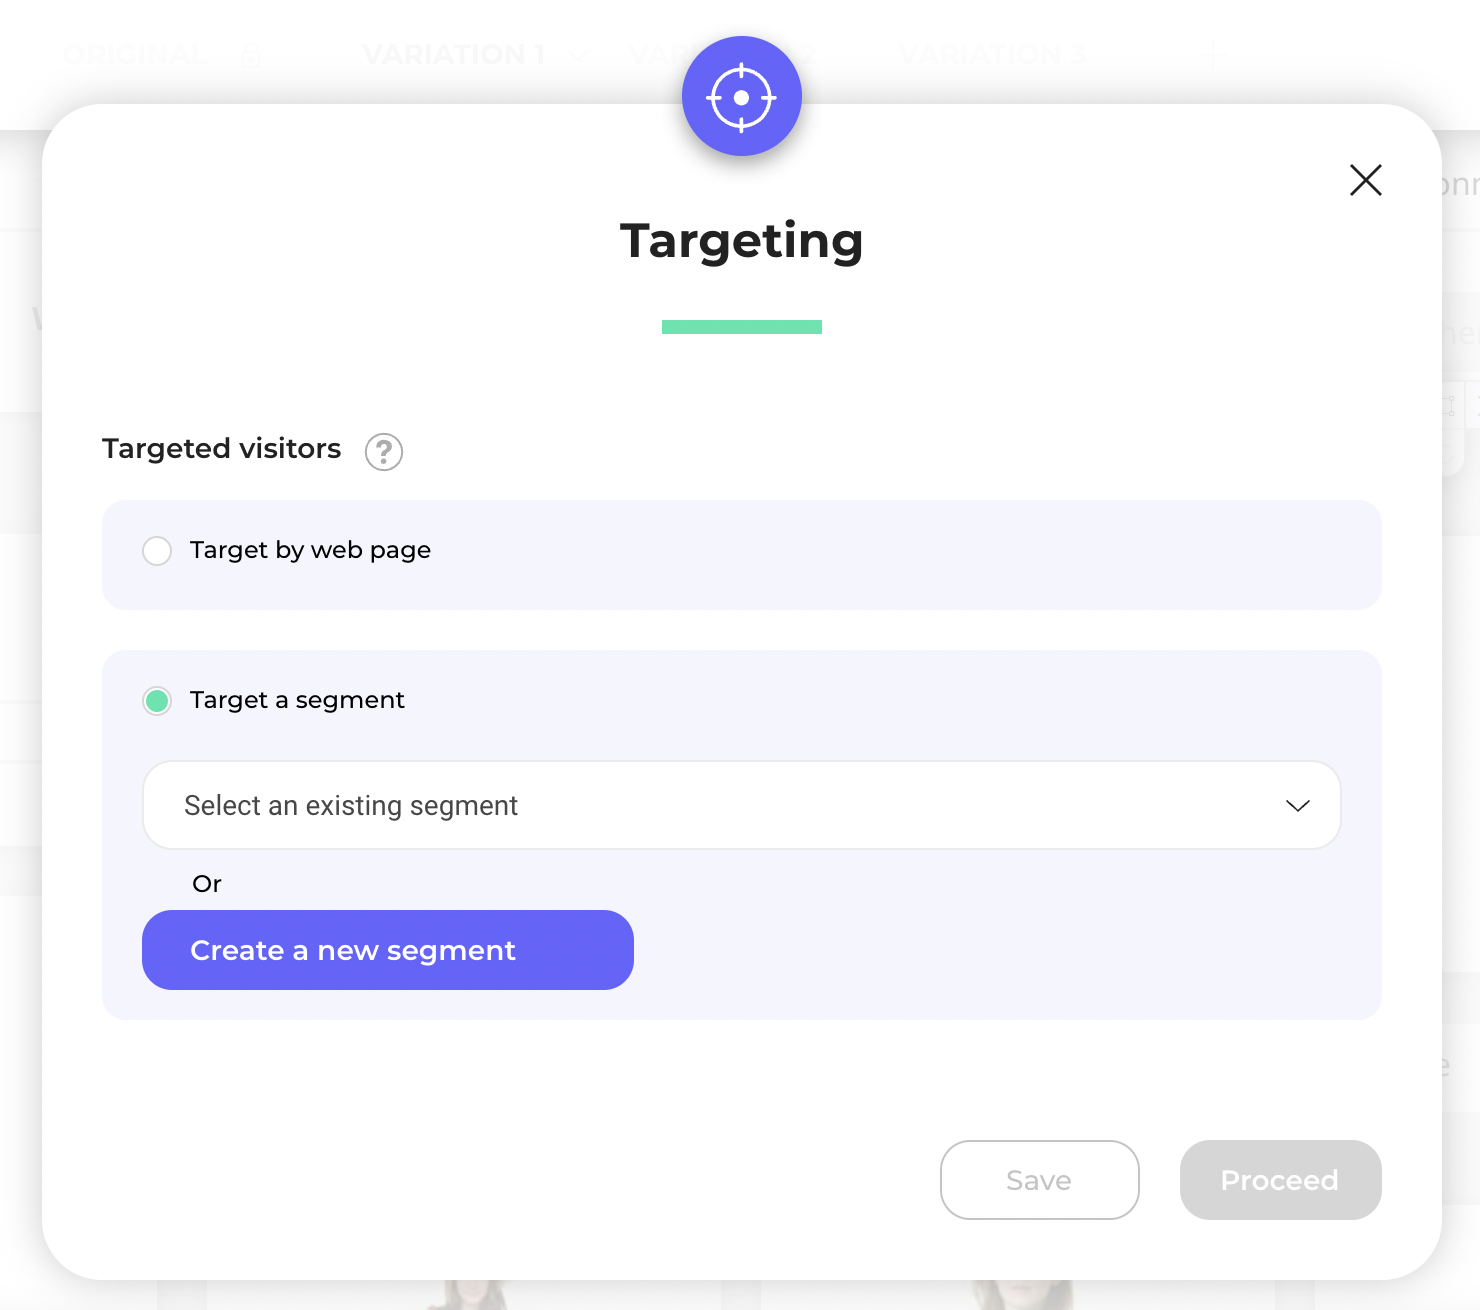
The first phase in finalizing your A/B experiment is targeting.

Create a new segment
In the Targeting step of the Finalization panel, click on Create a new segment.
You will be redirected to the Segments Dashboard and the segment creation pop-in will open.
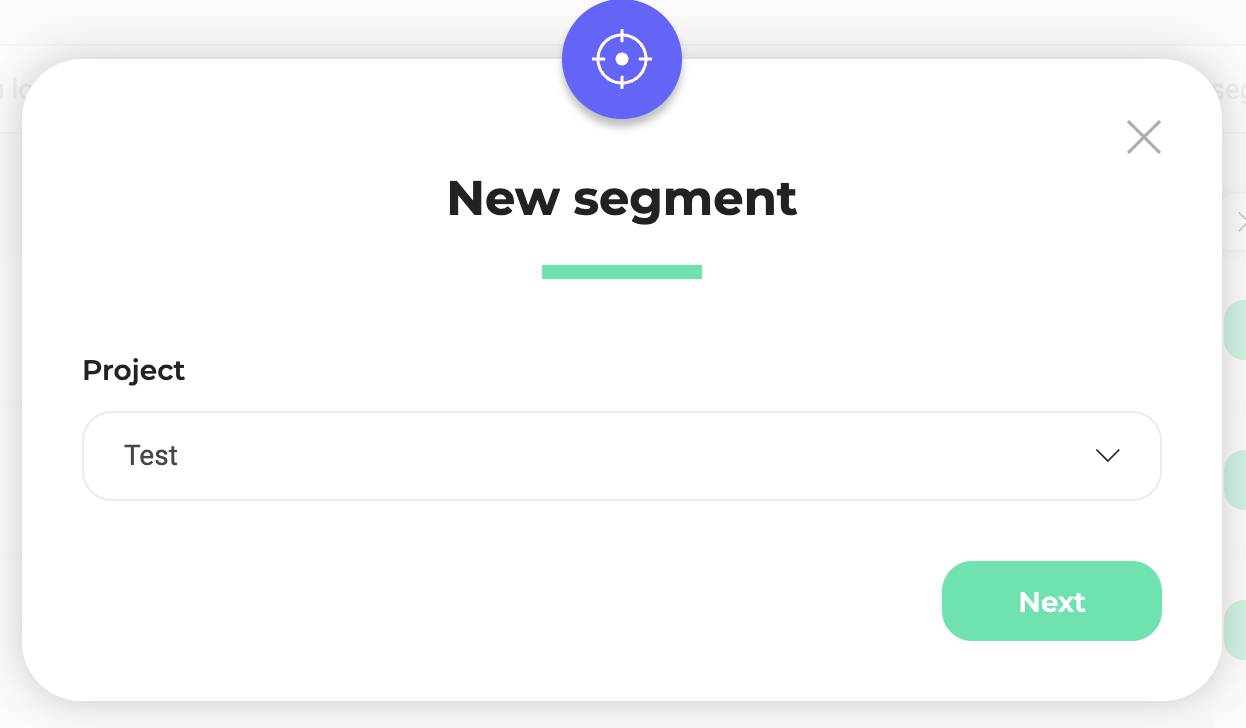
Select the project for which you want to create a segment and click Next.
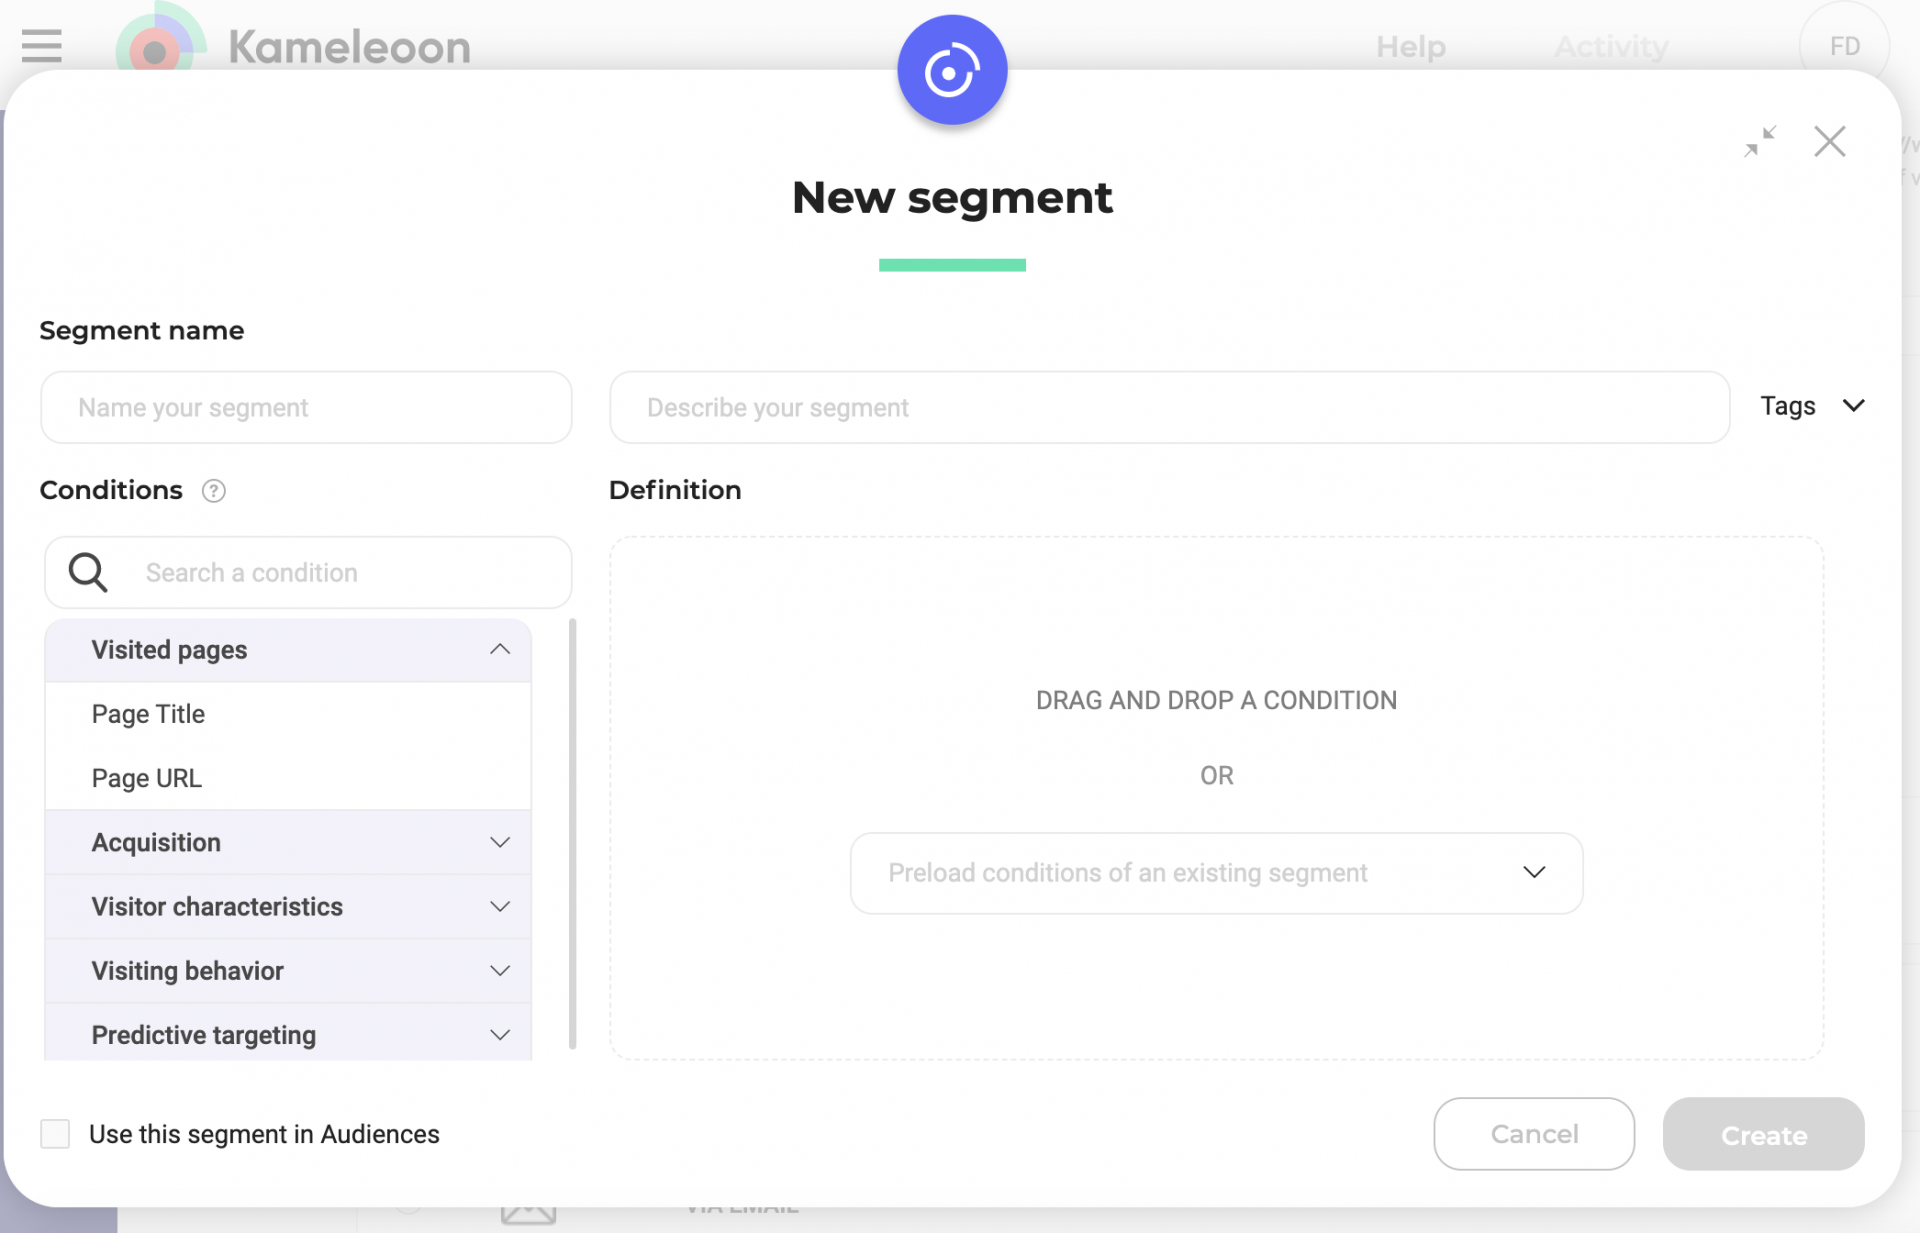
Once you have validated the configuration of your segment, you will be automatically redirected to your campaign in the Graphic editor, with the segment associated with it.
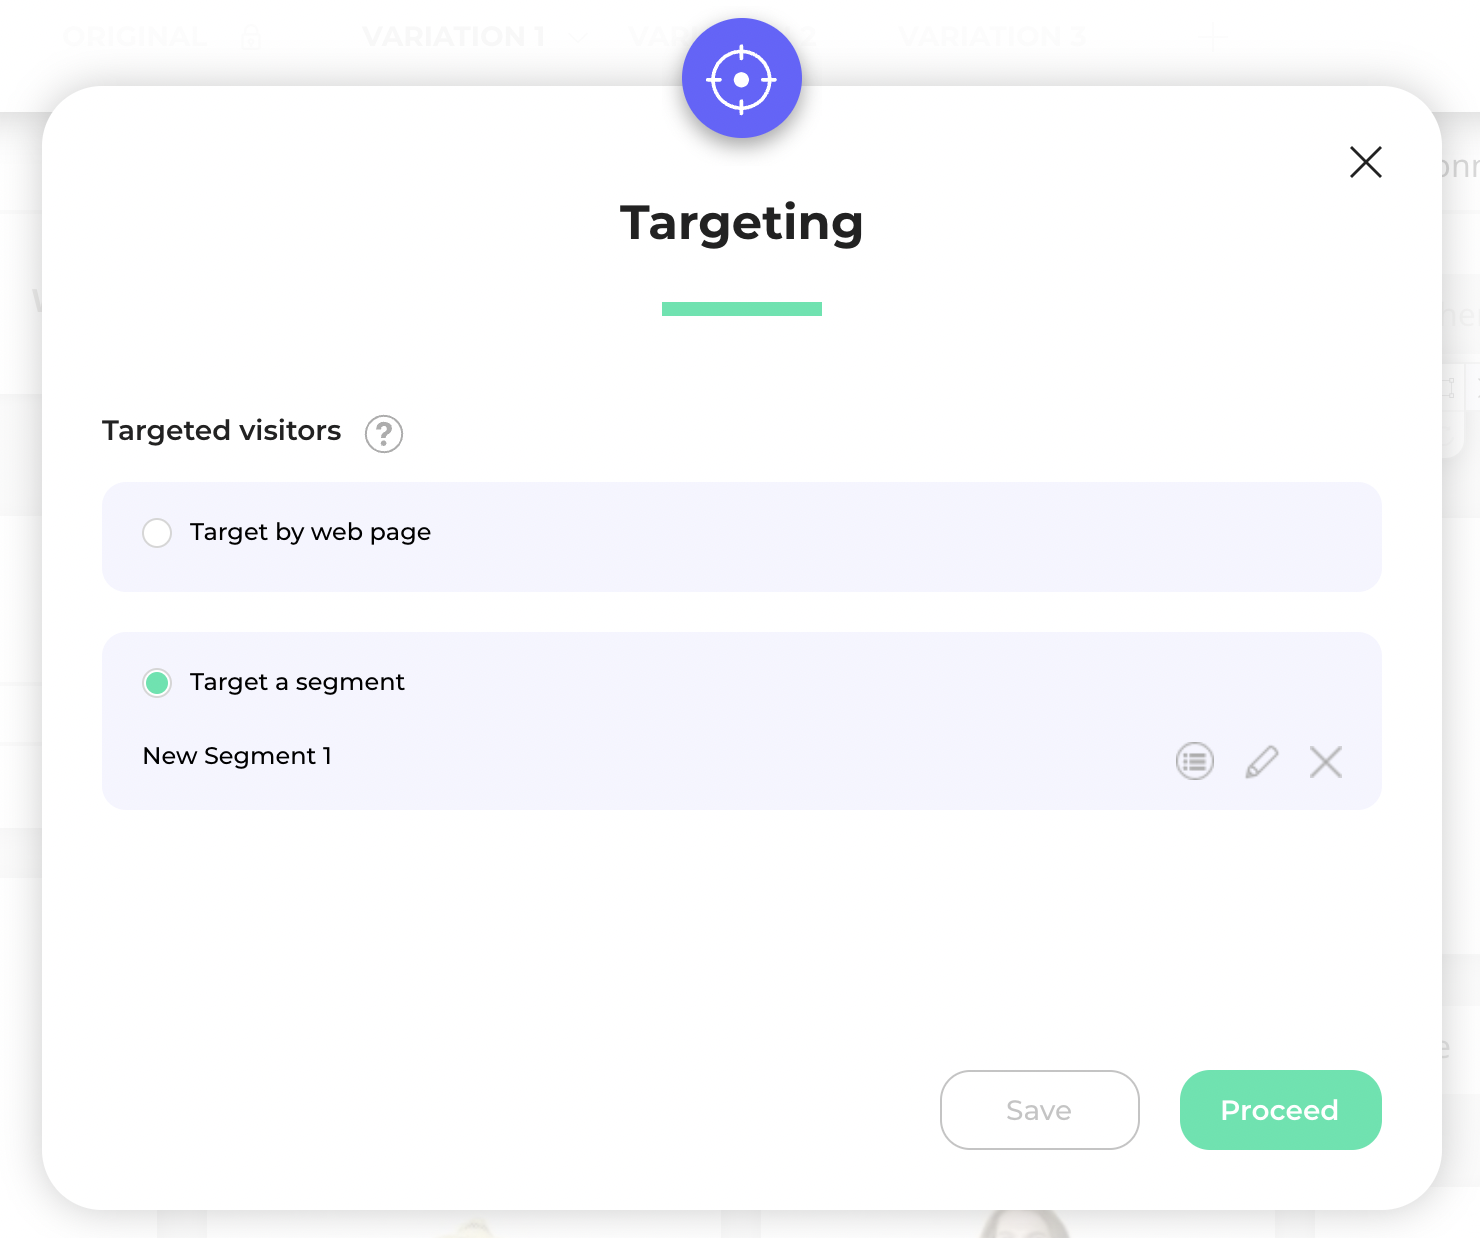
Associate a segment to your experiment
In the Targeting section of the finalization page, choose Target a segment and select your segment from the list.
Then click on Next to validate this step.
Target by webpage
You can also define targeting based on your site’s pages.

A specific page
You can target visitors based on the exact URL of the page they’re visiting. Specify the page’s URL in the text box. When you select this option, the targeting will apply not only to the specified URL, but also to any version of the URL that includes parameters (for example, query strings or hash fragments). So, if a visitor is on the specified URL with any additional parameters, they will still be targeted. For example, targeting www.example.com/product will also match www.example.com/product?ref=homepage.
The URLs containing a specific fragment
You can target visitors who are on a page whose URL contains a specific fragment. Specify the fragment in the text field. This option is useful when you want to include multiple pages or variations of a URL without listing each one individually. For example, targeting the fragment /product will match URLs like www.example.com/product/123, www.example.com/category/product?, or www.example.com/product-review.
The URLs of all modified pages
You can target the pages that have been modified as part of your experiment or personalization. When you select this option, the campaign will apply to the URLs of all pages where changes have been made, based on the modifications configured in the editor.
The entire site
If you want your campaign to run across all of your site’s pages, select The entire site. When you select this option, every page within the project scope will be included, regardless of the URL structure or parameter.
Note: Ensure you use this option only when the campaign is relevant to users’ experience across your entire site.
Distribute the traffic
The second phase of finalizing your A/B experiment is traffic allocation, i.e. the percentage of your visitors who will see your variation(s). By default, the traffic is evenly distributed among the variations; however, you can change this setting.

To change the traffic allocation, click and hold the mouse down to drag the slider of a variation; alternatively, enter the percentage directly by clicking on the number displayed to the right of the slider.
Then click on Next to validate this step.
Excluded traffic
The traffic that you don’t assign to any of your variations will be automatically attributed to Excluded traffic. These visitors will see the original version of your page.

Equal allocation per variation
When you run an experiment on your production website, you have the possibility of specifying the percentage of your traffic to divert to the variations (this is step 2 in the launch pop-in for your experiment).
For example, if you have 3 variations in your experiment, setting a diversion percentage of 75% will tell Kameleoon to divert 75% of your traffic to your variations and 25% to your original page. By default, Kameleoon will then display Variation 1 for 25% of the time, Variation 2 for 25% of the time and Variation 3 for 25% of the time.

Different allocation per variation
You also have the possibility to allocate different parts of your traffic to each variation. To do this, use the sliders to modulate the required percentage for each variation.

You can also click on the percentage and directly enter the value you want to apply to the variation.
At any time, you can return to an equal distribution between the variations by clicking on the Allocate equally button, which is just below the list of variations.

Automatically optimize traffic allocation: multi-armed bandit

You can also let Kameleoon automatically manage your traffic allocation, in real time, based on the performance of the variations. Kameloon also features a multi-armed bandit algorithm, based on the epsilon-decreasing approach. This allows you to limit the opportunity cost of an experiment made up of “lost” conversions on the least effective version. This alternative to the traditional A/B testing approach uses adaptive learning to select the best variation among several options. This type of traffic distribution is recommended if you are short of time.
If you check the Automatically optimize traffic distribution option, then, based on the first results observed during the experiment period, Kameleoon will disable the worst-performing variations of your experiment and divert traffic from these variations to the best-performing ones.
Note : Dynamic traffic allocation has its limits. It doesn’t take the preferences of each visitor into account; instead, it seeks to maximize the performance of certain variations. If an element has proven successful with a segment of visitors, but that element is part of a low-performing variation, then these visitors will be redirected to a variation that is of interest to the greatest number of visitors.
Contextual bandits
Contextual bandits dynamically optimize traffic allocation in experiments using machine learning. They adapt in real-time to redistribute traffic based on variation performance and user context to maximize effectiveness.
Key differences exist between multi-armed bandits and contextual bandits. Understanding these differences is critical for choosing the best method for your experiments:
- Multi-armed bandits:
- Multi-armed bandits optimize traffic distribution among multiple variations (arms) to maximize a defined goal, such as click rates or conversions.
- Multi-armed bandits treat all users equally; no distinction is made based on user attributes.
- Ideal for scenarios where user-specific data is unavailable or unnecessary, and the focus is on finding the best-performing variation for the overall audience.
- Contextual bandits:
- Contextual bandits incorporate additional user-specific data, like device type, location, or behavior, into decision-making.
- Contextual bandits allow more personalized decisions, tailoring variations to specific users for improved outcomes.
- The variability introduced by user attributes allows contextual bandits to optimize decisions in dynamic environments.
So, multi-armed bandits optimize traffic allocation uniformly across users, while contextual bandits leverage contextual data to make personalized decisions.
If you would like more details on how Kameleoon’s contextual bandits work, you can read our Statistical paper.
Configuring contextual bandits
To enable contextual bandits:
- Navigate to the Finalization panel.
- Click Traffic allocation.
- Click the dropdown menu beneath “select the allocation method”.
- Click Contextual bandit.
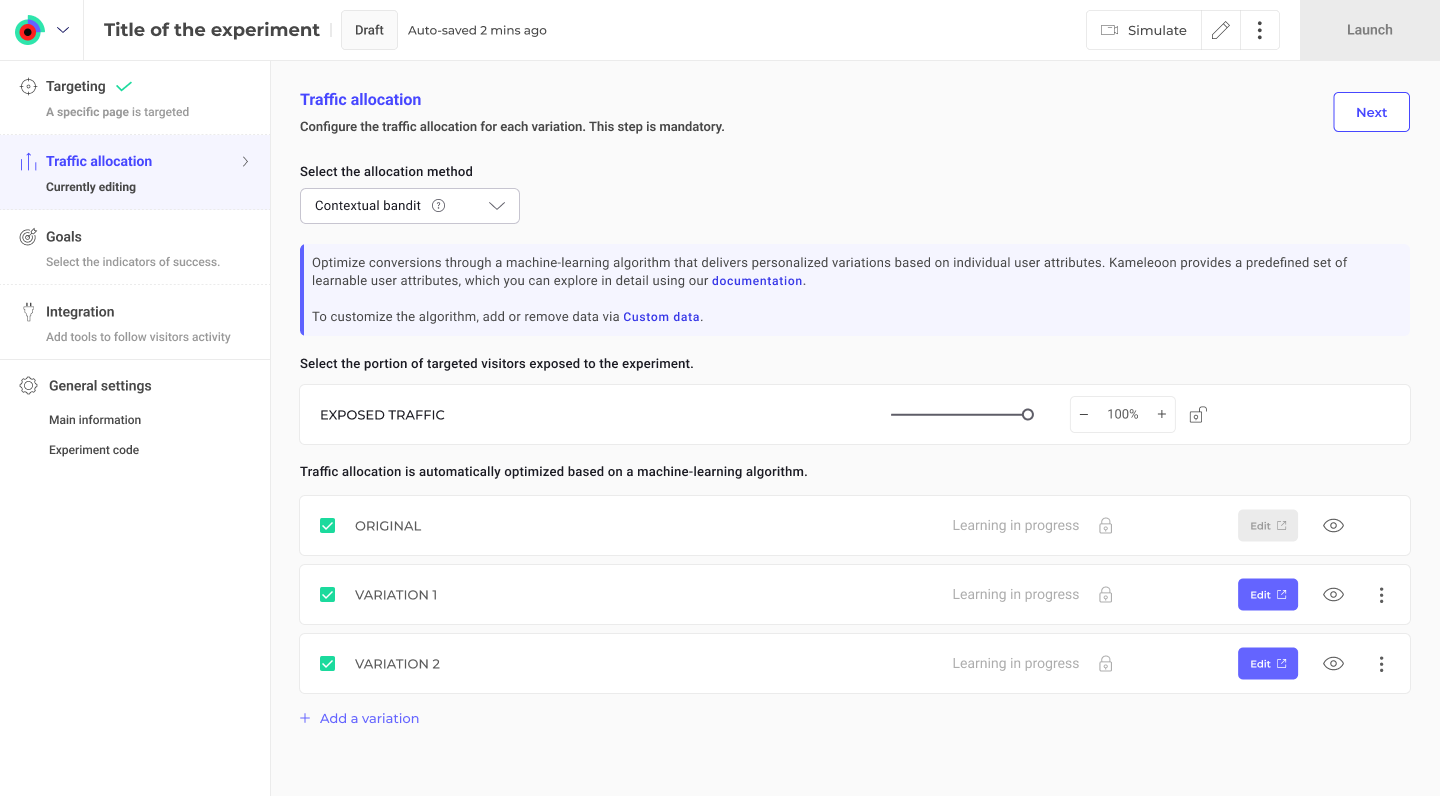
By default, the algorithm will begin optimizing traffic based on predefined user attributes available in Kameleoon.
However, to fully leverage the power of contextual bandits—especially with the Contextual Bandit Premium feature included in the AI Predictive Targeting add-on (paid or trial)—you can provide custom data as additional input to the machine-learning model. Custom data allows the algorithm to make even more accurate predictions by incorporating business-specific attributes (e.g., CRM segments, purchase history, in-app behavior).
To activate the use of custom data in your experiment:
- Go to your custom data configuration panel.
- Enable the “Use this custom data as input for AI Predictive Targeting” option.

Once enabled, Kameleoon’s algorithm will use these attributes as part of the decision-making process to deliver the most relevant variation to each visitor.
To learn more about AI Predictive Targeting, read our article on the subject here.
Advanced reallocation
The Advanced reallocation feature allows you to redistribute traffic among variations in your experiment. When applied, the traffic allocation is reset, and visitors who had previously seen a specific variation will be treated as new visitors. This can be particularly useful when you want to focus on a subset of variations or exclude certain variations from receiving further traffic.

Click on the Advanced reallocation option located at the top-right of the traffic distribution step. In the panel that appears, you can choose which variations will be part of the reallocated traffic.

This reallocation will be effective once you’ll have clicked on the Reallocate button and then on the Save button on the top right corner of the page.
Define goal(s)
This step is mandatory unless you configured an integration (reporting tool).
Select one or several goals to activate Kameleoon as a reporting tool.
What is a goal?
To use Kameleoon reporting, you must define a conversion goal. This goal is what you want to improve with your A/B experiment.
Several goals are available:
- Engagement: this goal is achieved if the visitor visits other pages after the landing page;
- Click tracking: this goal is achieved if the visitor clicks on a specific element you defined;
- Scroll tracking: this goal is achieved if the visitor scroll beyond a specific part of your page;
- Access to a page: this goal is achieved if the visitor reaches a page of your choice;
- Number of page viewed: this goal is achieved if the visitor visits the number of pages of your choice;
- Time elapsed: this goal is achieved if the visitor spends a predefined amount of time on your website;
- Custom goal: for more complex goals, you can create custom goals via a Kameleoon API call.
Create a new goal
To learn how to add a new goal, please read this article.
Associate a goal to your experiment
Once you have created a goal, you need to associate it to your experiment.

Find your goal in the list and click on it. You can view its details by hovering your mouse over the associated tooltip.

You can associate several goals to your experiment.
Note: When you associate several goals with an experiment, the first goal in the list is automatically designated as the primary goal. If you wish to change the primary goal, simply drag and drop the desired goal to the top of the list. The new first goal will become the primary one for reporting purposes.
Click on Next to validate this step.
Set up reporting tools
This step is mandatory unless you configured a goal.
Add a new integration
To learn how to add a new integration, please read this article.
Activate an integration on an experiment
Once a reporting tool has been added to your list of integrations on the Integrations page, you can associate it with a campaign.

To do this, in the Integrations step of the finalization page, find the tool in the list and click on it.

You can activate several integrations on an experiment.
Click on Next to validate this step.
General settings
Main information
The Main information tab lets you manage your experiment’s main information. You can:
- Edit the URL to load in the editor.
- Edit or add tags.
- Edit or add a hypothesis (the purpose of your experiment).
Experiment code
The Experiment code lets you add code that will be applied to each variation in your experiment. Code here will be executed after experiment initialization, before variation script, and when a visitor meets your targeting criteria.
Click JS or CSS to select your desired code type. Click the Add code to the original too toggle to add the code to your original (control) variation.

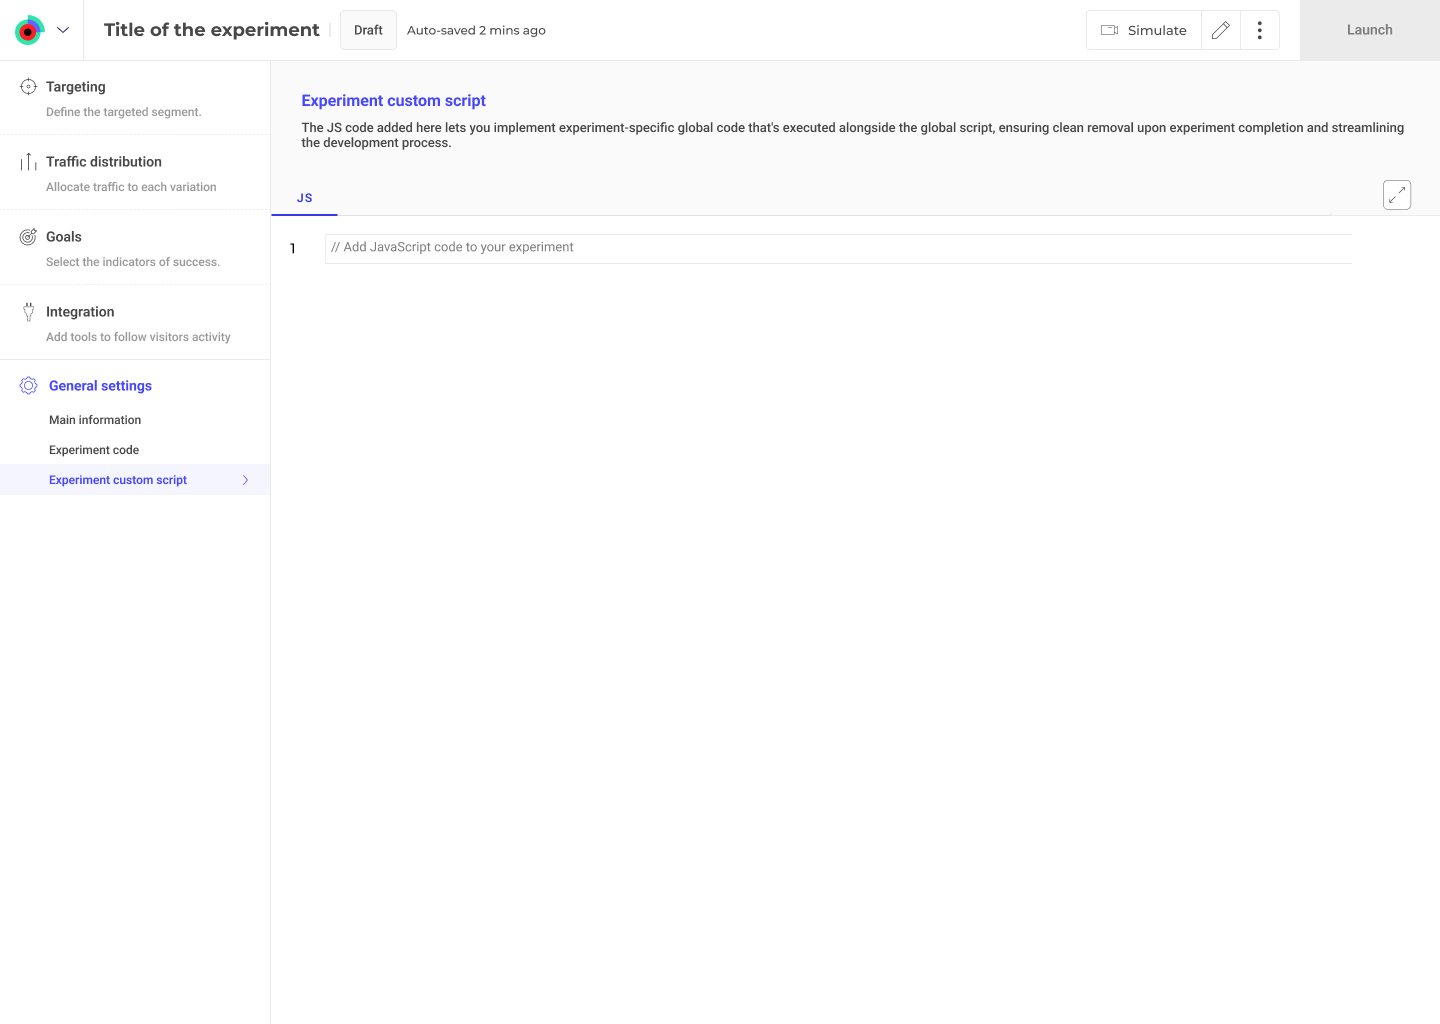
Experiment-specific custom script
Experiment-specific global code allows developers to manage experiment-specific scripts directly within the experiment. This global code field simplifies adding temporary code for precise targeting or simulating global scripts while ensuring efficient code management. The associated script is automatically removed when an experiment ends. This removal optimizes performance and maintains a clean codebase.
Implementing custom scripts
To implement experiment-specific custom scripts:
- Click General settings > Experiment custom script.
- Click the text field and insert your desired JS code.
Simulate

Simulation mode allows you to check if:
- Your variations or personalizations are displayed correctly;
- The targeting of your campaign is configured correctly, and if not, understand why;
- The goals you have defined convert or not;
- Your different visitors see the right content for them at the right time.
For more information about simulation, please read this documentation.
Simulate an experiment and preview it are two different actions. To learn more about the preview, you can read our article on the subject.
Estimate the duration
In the finalization panel of the editor, it is possible to estimate the duration of an experiment.

To do this, you must fill in certain information:
- Average number of visitors per day visiting the tested pages – This is the amount of daily visitors your test will target daily across all the test’s variations.
- Current conversion rate of the goal (which will be used as a reference) – This is an estimation of the current conversion rate of the main goal of the experiment you are trying to improve.
- Minimum Detectable Effect (MDE) – This is the minimum effect size you would like to be able to detect. This is relative to the control mean of the goal you are trying to improve. As an example, if the conversion rate of your control variation is 1%, an MDE of 5% will let you detect if the conversion rate goes below 0.95% or above 1.05%.
- Desired reliability rate (by default, it is 95%, but you can change its value) – This setting lets you balance the risk of detecting an improvement which is not real – a false positive result. A common value is 95%. Increasing this parameter will lower your risk of getting a false positive result at the cost of increasing the required number of visitors needed to detect the same change.
Note: This is an estimation; once your experiment is launched, the reliability index will let you know if your results are reliable or not.For more information, you can consult our documentation on the results page.
[If some of these terms leave you speechless, do not hesitate to consult our lexicon to learn more about the data processed by Kameleoon.]

The estimator automatically takes into account the traffic allocation and the number of variations.
Launch
Launch immediately
When all of the mandatory finalization steps are completed, a green check icon appears.

The simulation step is strongly recommended but not mandatory. It helps check your variation’s display, your experiments’ targeting and whether the defined goals lead to conversion.
When your are satisfied with your variations and your experiment is set, you can click to launch it.

A Configuration summary panel allows you to check if all of your experiment settings are okay.

If you want to change some settings, you can edit them by clicking on it and then on Edit.

If everything seems fine to you, click on the Launch button on the bottom right.

Congratulations, your experiment is now online!
Note: There may be a short latency time (up to 10 minutes) between the launch of an A/B experiment and its visibility on the website. Don’t worry if your experiment does not appear immediately!
Schedule
You can schedule your experiment by defining a starting date, an ending date or both.
To do so, you can either click on Schedule in the 3-dot menu:

Or click on Schedule at the bottom of the Configuration summary.

A panel will open allowing you to schedule your experiment.

Advanced schedule allows you to set the time zone and/or set an automatic experiment stop. The automatic stop can take place when the reliability rate has reached the configured value and has stabilized; or when the traffic has reached a certain threshold, which you must define.
We recommend you not to define an end date before launching your A/B experiment, as only the trust rate will tell you if your experiment can be stop of if it should still run before having reliable results. However it can be very useful if you want to run your experiment on a specific period or event for example. In all cases, we recommend you to check the trust rate before reading your results.
Edit an experiment
The finalization page adapts during the creation and configuration of your experiments.
- Launch when your experiment has not yet started;
- Save when your experiment is already online or paused;
- Results when your experiment is stopped.

Update an online experiment
If your experiment is online or paused, the button becomes Save.
On click, a new Configuration summary opens.

Important: Modifying an online experiment will have consequences on the results. We advise you to duplicate it or to create a new one.
You can duplicate your experiment by clicking on the Duplicate button, or decide to apply your changes to this experiment anyway (Re-configure).
To modify an online or paused experiment from the dashboard, click on the 3-dot menu at the end of the experiment line and click on Edit configuration. The Graphic editor will open.

