
In this article:
– The definition of a MVT
– How to create a MVT using Kameleoon’s Graphic editor
– How to define the goals and metrics for your MVT
– How to configure the MVT settings, such as targeting options and traffic allocation
– How to launch and monitor your MVT
– How to analyze and interpret the results of your MVT using Kameleoon’s reporting tools (and best practices for ensuring the accuracy and reliability of your MVT results)
All our A/B testing plans include the creation of MVT experiments.
What is a multivariate test?
While a classical A/B experiment consists of a reference version and a variation, multivariate tests (MVTs) enable you to change several elements on the same page and to analyze which combination generates more conversions. Let’s look at the example of a simple MVT that compares the performance of six CTAs:
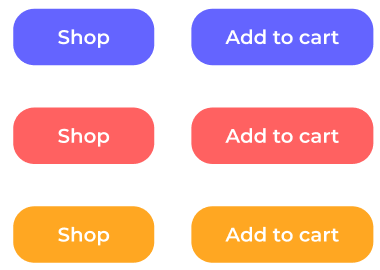
In the example, there are three colors (blue, red, orange) and two wordings: Shop and Add to cart.
With an MVT the 6 possible combinations can be compared.
MVT Glossary
Multivariate test: A multivariate test offers to test the conversion of one or several combination(s) of several elements.
MVT: MVT stands for MultiVariate Test.
Section: A section groups several variations of an element.
Variation: The variation is a suggested change for a given element. It differs from the reference version. A MVT can include several variations that are gathered in sections.
Combination: Combination means that several variations from different sections are combined and displayed to exposed visitors.
Creating an MVT experiment
In the App
In the Experiment dashboard, click New experiment.

In the pop-in that appears, click In the graphic editor > Multivariate experiment (MVT).
In the Graphic editor
Once logged in, you can choose Create an MVT experiment on the home screen.

You can indicate the experiment’s name, add a description, and associate tags in the pop-in that opens.

After validation, you must set up sections and variations for your MVT.
Set up your MVT sections and variations
Several variations make up a section.

Remember, we are testing a CTA’s color and wording. There are three colors (blue, red, orange) and two wordings: Shop and Add to cart.
You can create a first section (Section A, which we call COLOR) for colors, which includes your reference version, and the red and orange variations.

You want to test the CTA’s wording and compare Shop with Add to cart now. Create a second section (Section B, which we call WORDING) for the wording which will include your reference version and the Add to cart variation.

Click Create: the MVT version of the graphic editor opens.
The MVT editor
You can create your variations’ content the same way you would in an A/B experiment. However, the MVT editor is slightly different.

Sections
Click a section in the left sidebar to select it.

Several options are available here:
- Click the duplicate icon to duplicate the section.
- Click the three-dots menu to:
- Rename the section.
- Delete the section.
Note: You must have at least two sections in an MVT experiment.
Variations
The selected section’s variations are displayed in the left sidebar. Several options are available:

- Click the duplicate icon to duplicate the variation.
- Click the three-dots menu to:
- Rename the variation.
- Add custom code (JS or CSS) to the variation.
- Preview the variation in a new tab.
- Search and replace words on the page
- Delete the variation.
If you delete all variations associated with a section, you will delete the section itself.
Note: We recommend you introduce changes to no more than two elements in your page (so, a maximum of two sections) with three to four variations of the element.
Why? For an MVT, the sections’ variations are associated to find the best combination. The more sections you create, the more traffic you need to get usable, reliable results.
To learn more about this subject, please refer to our article on statistical significance.
Kameleoon automatically creates all possible combinations from each variation you design for a given experiment using Full Fractional factorial design, ensuring that all possible combinations are tested simultaneously.
Traffic allocation
Once you have created your variations, you must finalize your experiment before it goes online. You can do it the same way as with an A/B experiment. The only difference is your experiment’s traffic distribution.

Traffic allocation for the experiment
To manage the traffic allocated to the experiment, click and drag the slider next to Exclude a percentage of the exposed visitors to your desired percentage.
Traffic allocation for exposed visitors
You can distribute your traffic based on sections or combinations.
Traffic distribution by sections

Click Sections to distribute traffic by section. Check the checkbox next to a variation to include it in your experiment. To edit a variation’s traffic allocation:
- Click and drag the variation’s slider to adjust its traffic
OR
- Manually enter a percentage in the text field.
Click the padlock to prevent adjustments to a variation’s traffic allocation. Click the padlock again to make additional changes.
Example
In the example below, 30% of exposed visitors will see a red CTA and 40% will see an orange CTA.

Allocate equally

Click Allocate equally to distribute traffic between variations equally. Clicking Allocate equally undoes your changes.
Traffic distribution by combination

Click Combinations to distribute traffic based on the combinations you’ve created.
Suppose you want to test a CTA’s color and its wording. You have two sections, then: A (color) and B (wording).

| Section A: COLOR | Section B: WORDING |
| Variation A0: Original | Variation B0: Original |
| Variation A1: Blue | Variation B1: Add to cart |
| Variation A2: Red | |
| Variation A3: Orange |
The generated combinations have the following names:
- A0B0 Original / Original
- A0B1 Original / Add to cart
- A1B0 Blue / Original
- A1B1 Blue / Add to cart
- A2B0 Red / Original
- A2B1 Red / Add to cart
- A3B0 Orange / Original
- A3B1 Orange / Add to cart
You can exclude combinations in the Combinations tab. For example, in an MVT where you changed both the background and text colors, you can exclude combinations where the background and text colors are the same.
Edit the traffic allocated to a combination
Check the checkbox next to a combination to include it in your experiment. To edit a variation’s traffic allocation:
- Click and drag the combination’s slider to adjust its traffic
OR
- Manually enter a percentage in the text field.
Click the padlock to prevent adjustments to a combination’s traffic allocation. Click the padlock again to make additional changes.
Allocate equally
Click Allocate equally to distribute traffic between variations equally. Clicking Allocate equally undoes your changes.
Note: By default, the Sections tab is selected. The tabs are independent (editing the distribution for one of them doesn’t impact the other). The tab that is selected when you click Launch will be taken into account when distributing traffic.
Simulation, launch, analysis
Once you’ve created your variations and distributed traffic, simulation, launch, and analysis are the same as in an A/B experiment.
Simulate your MVT
We recommend simulating your experiment before going live.

The simulation panel generates your experiment’s combinations. Click Currently displayed in simulation to check the display of the combination of your choice.
Learn more about simulation in our dedicated article.
Launch the MVT
If everything is displaying correctly and your targeting, goals, and reporting tools have been set up, you are ready to launch. Click Launch.
Results
If you selected Kameleoon as your reporting tool, your MVT’s results are transferred to the A/B experiment results page. Each combination is considered as a variation (as defined for classical A/B experiments).
Note: You might experience a short latency time (up to 10 minutes) from the time you launch an A/B experiment to its visibility on your website. Don’t worry if your experiment does not appear immediately.
