
In this article:
– An overview of the experiment management dashboard and its features
– How to find and act on an experiment
– How to archive and delete an experiment
– Best practices for organizing and optimizing your experiment management process in Kameleoon
Access the Experiments Dashboard
To access the Experiments Dashboard from the App, use the left side menu > Activate > Web experiments.

Structure of the Dashboard
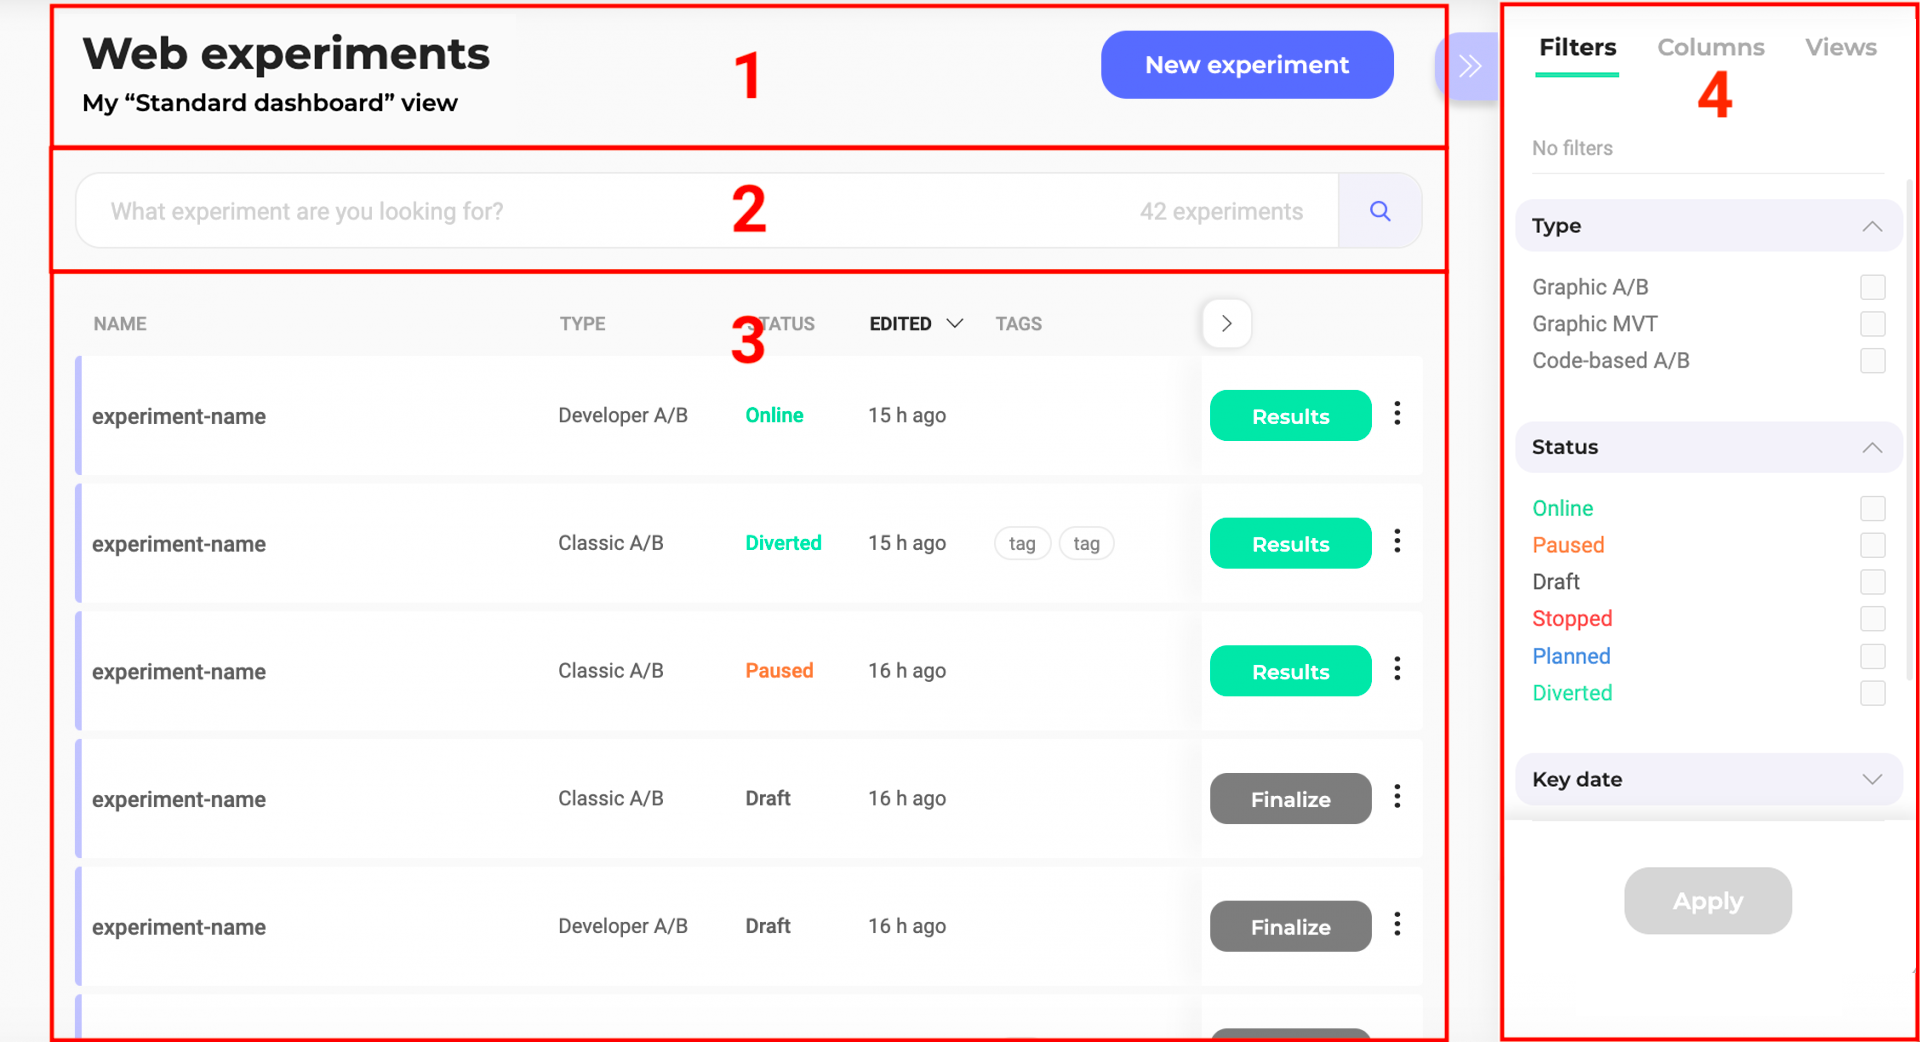
- Header: title of the current view; button to create a new experiment
- Search bar: search tool; number of experiments currently displayed on the Dashboard
- Cards and columns: information on the experiments; Results/Finalize buttons; sorting tool; three-dot menu (on the right) to apply actions to an experiment
- Sidebar: filters; columns; views; secondary actions linked to the three-dot menu
Experiment information
Each experiment is represented by a card that indicates the main information.
Want to know more about an experiment? Mouse over the tooltip displayed to the right of the campaign name and you’ll have access to a plethora of detailed information without needing to open our editors or the results page.

Find an experiment
If you have created a large number of experiments, a search bar, a filtering tool and a sorting tool allow you to easily find a particular experiment.
With the right-hand panel on your dashboards, you can directly apply many filters. To sort the data displayed, just click on the column headers. Two very useful features for finding the campaign you’re looking for in no time at all.
Filter

You can filter your experiments according to several criteria:
- Website
- Type
- Status
- Key date
- Tag
- Goal
- Segment
- Author
Note: Once you apply filters, Kameleoon generates a unique URL with custom parameters, which you can then share with other members of your team. Just click on Copy link to this filtered dashboard located on the right of the dashboard title.

- Website
You can filter the displayed experiments according to the website(s) they are associated with.
Check the website(s) and click on Apply.
- Type

You can filter the displayed experiments according to their type. For example, you can choose to display only the Graphic A/B experiments.
Check the type(s) and click on Apply.
- Status

You can filter the displayed experiments according to their status. For example, you can choose to display only the diverted experiments.
Check the status and click on Apply.
A web experiment can have several statuses reflecting its lifecycle: Draft means the experiment is being configured and has not been live yet. Planned indicates the experiment has been scheduled to start at a future date or time. Online means the experiment is actively running and visible to targeted visitors. Paused means the experiment has been temporarily halted but can be resumed later. Stopped designates an experiment that has been permanently ended. Diverted refers to a stage in an experiment where 100% of the traffic is redirected to a single variation (typically the winning one). This is commonly used when a winning variation has been identified, but the corresponding changes have not yet been implemented in the website’s permanent codebase.
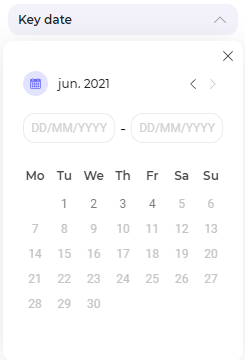
- Key date

You can filter the displayed experiments according to the key date they are associated with: last modification, last status change, launching date (“Go-live”) or creation date.
Select a date and click on Apply.
- Tag

You can filter the displayed experiments according to the tags associated to them and created on the related account.
Check the tag(s) and click on Apply.
- Goal

You can filter the displayed experiments according to their goal(s).
Check the goal(s) and click on Apply.
- Segment

You can filter the displayed experiments according to the segment associated to them.
Check the segment(s) and click on Apply.
- Author
You can filter the displayed experiments according to their author.
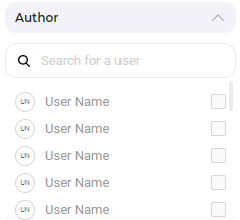
Check the author(s) and click on Apply.
Sort

The sorting option allows you to sort your experiments according to several criteria:
- Name
- Type
- Edited
- Created
- Launched
- Website
- Name
Hover over Name and then click on the chevron to sort experiments in alphabetical (or reverse alphabetical) order.
- Type
Hover over linked to and then click on the chevron to rank the experiments based on their type.
- Edition date
Hover over Edited and then click on the chevron to sort experiments from newest edition to oldest or vice versa.
- Creation date
Hover over Created and then click on the chevron to sort experiments from newest creation to oldest or vice versa.
- Launch date
Hover over Launched and then click on the chevron to sort experiments from newest launch to oldest or vice versa.
- Website
Hover over Website and then click on the chevron to organize the website on which they are set in alphabetical (or reverse alphabetical) order.
Columns
You can customize the layout of your dashboards by adding, removing, or rearranging columns. This enables you to streamline your focus directly on the information that truly matters to you.

You can choose which information you want to display on your dashboard by selecting the columns in the Columns tab of the sidebar: checking a column means it will be displayed. To change the display order, drag and drop the cards and rearrange them as you like.
After changing the selection of columns to be displayed, clicking on Reset will restore the original columns configuration:

Sort by
The sorting rule allows you to choose the order in which the campaigns will appear on your dashboard.
You can sort by:
- Name
- Type
- Status
- Last edition
- Tags
- Creator
- Creation date
Save as a View
Additionally, you have the option to save these configurations as a View and re-apply it later. You can also make it your dashboard’s default view.
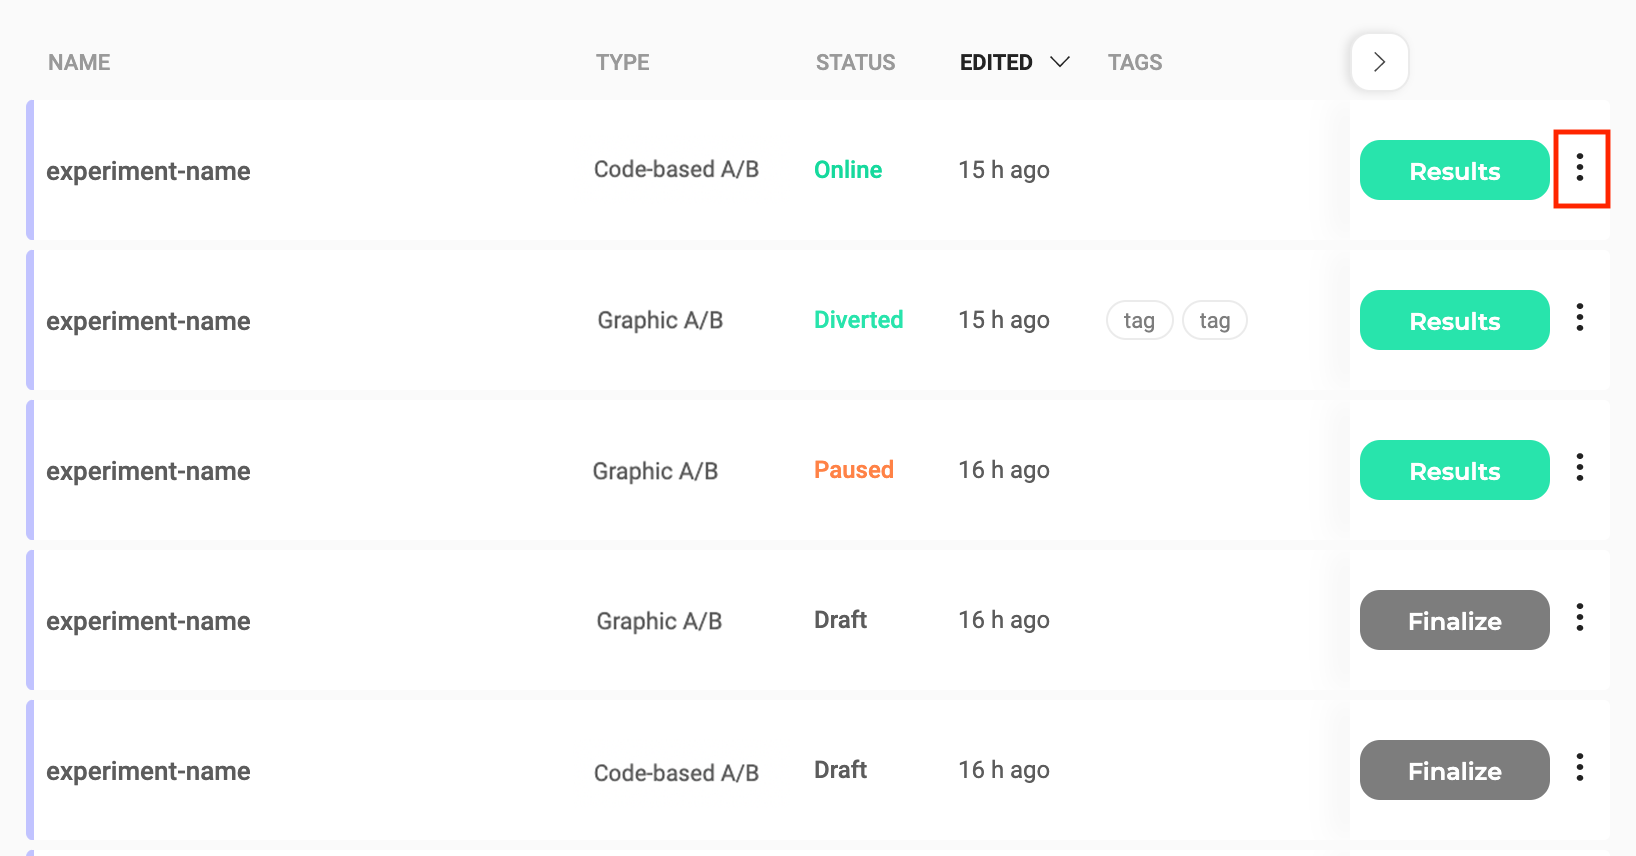
Actions on an experiment
Click on the 3 dots located to the right of each card to access a wide range of actions. The available actions depend on the status of your experiment.
To edit an already existing experiment, find the card of the experiment you want to edit.
Click on the 3 dots icon to display the secondary actions menu.

When your changes are complete, click on Validate to save them.
Pause
You can pause an online experiment. Its status becomes paused.
A notification is displayed to confirm your action.
Stop
You can stop an online experiment. Its status becomes stopped.
A notification is displayed to confirm your action.
Stopping an experiment allows you to delete it if necessary.
Delete
Select the experiment of your choice, then click on the 3 dots menu on the very right side of the card and click on Delete.
You can only delete a stopped or draft experiment.
Edit
Depending on the type of experiment and its status, you can edit your experiment in one or both of our editors: the Graphic editor or the Code editor. Click on the option that suits you and you will be automatically redirected.
Simulate
You can simulate an experiment. It will open the simulation panel on your website page.
This is a new feature, enjoy it!
Rename
You can rename an existing experiment.

The Rename sidebar opens. To validate the renaming of the new experiment, click on the Save button at the bottom of the pop-in.
You can manage the tags associated to an experiment.
The Manage tags sidebar opens.

Tags associated to your experiment are highlighted in the list and on the experiment card. You can associate other tags and create new ones before associating them.
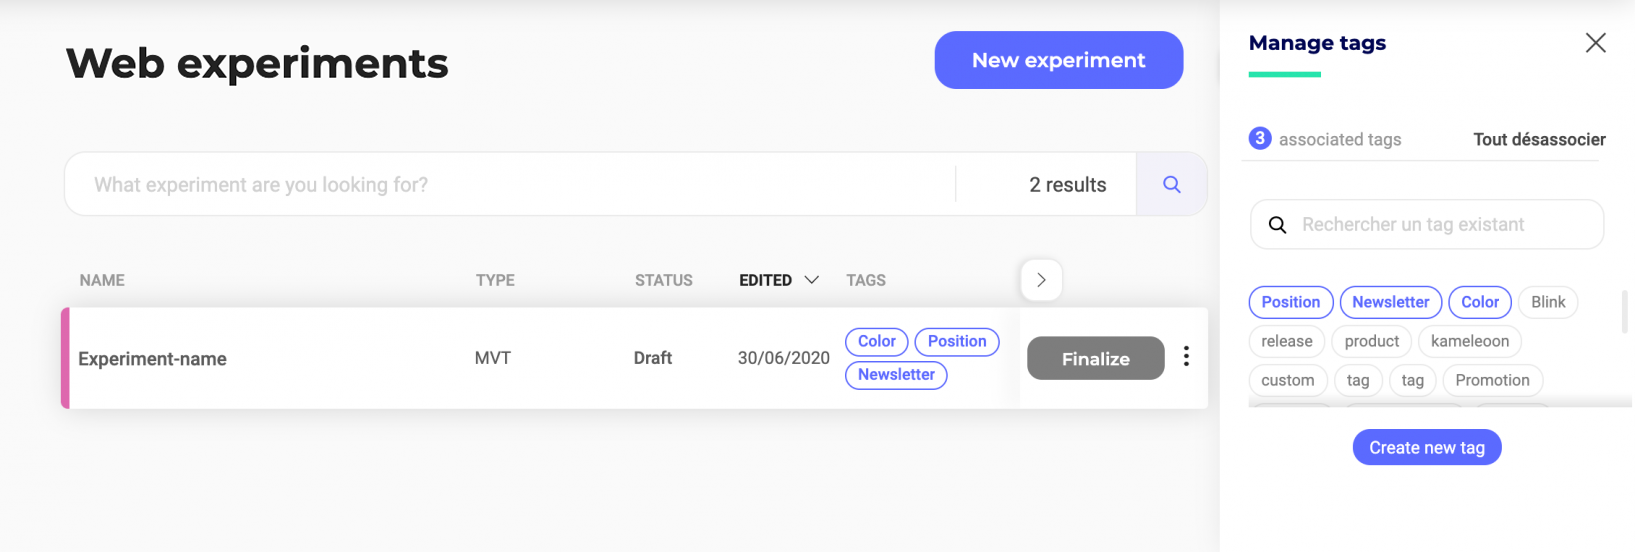
To validate your choices, click on the Save button at the bottom of the pop-in.
Duplicate
You can duplicate an existing experiment. This saves you time if you want to create several similar experiments.

The Duplicate sidebar opens. To validate the creation of the new experiment, click on the Save button at the bottom of the pop-in. You will be able to find it in the Dashboard.
Archive
You can perform this action only on Draft or Stopped experiments.
Once an experiment has been archived, it can only be retrieved from the Archived experiments view.
Multiple selection
You can select multiple experiments at the same time and apply a common action to them. For example, it is possible to archive several experiments or to export them.
Select the experiment of your choice, then click on the 3 dots menu on the very right side of the card and click on Select.

The experiments become selectable and the Grouped actions sidebar opens.

Several actions are possible:
- Select all/Unselect all
When at least one experiment is selected on the page, but not all are, the icon looks like this:

Click on Options to select or unselect all the experiments.

The actions you will perform later via the menu bar will be applied to all selected experiments. This feature saves time!
- Manage tags
- Pause (Only available for Online experiments)
- Stop (Only available for Online experiments)
- Archive (Only available for Draft and Stopped experiments)
- Delete (Only available for Draft and Stopped experiments)
- Export
Views
Create a view to save all filters applied, as well as the columns displayed and their order. You can then retrieve it with a single click from the Views tab on the right-hand sidebar.
For example, you can create a view displaying only the online and diverted graphic experiments.

Name your view and click on Save.
Note: Once you create a view, , Kameleoon generates a unique URL with custom parameters, which you can then share with other members of your team. Just click on Copy link to this view located on the right of the dashboard title.
To see your view as soon as your dashboard loads, simply set it as the default view.

You can find all your views in the Views tab.
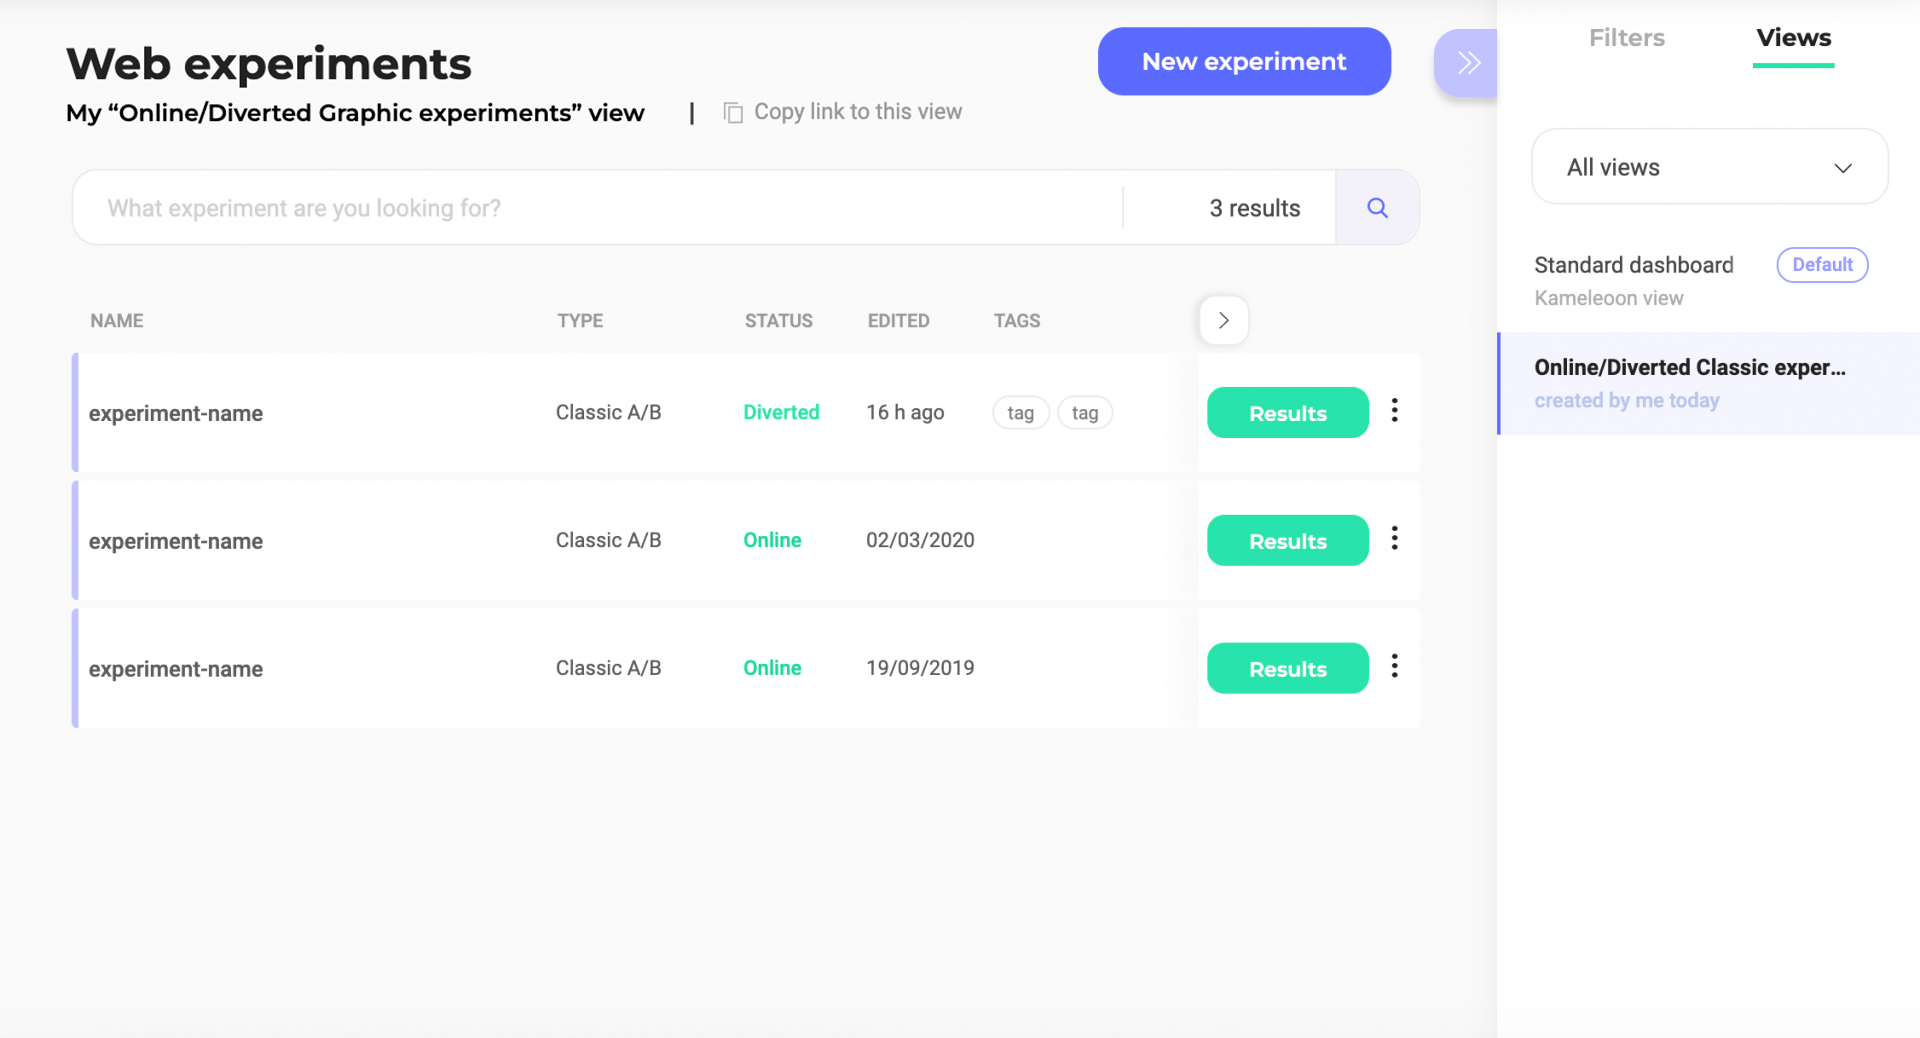
Clicking on the subtitle of your page gives you direct access to the filters applied in the sidebar. For example, here you can click on My view Online/Diverted Classic experiments on the left side of the upper part of the Dashboard; the filters will be displayed and highlighted in the sidebar.
Archived experiments

Kameleoon offers a default view of your archived experiments. Click to switch to this view. Only archived campaigns are displayed on your Dashboard. You can view their details and restore them if you wish.

By clicking on the 3-dot secondary action icon, you can simulate or permanently delete the archived experiment; and access its results in the case of a stopped experiment.
