Bayesian
About the Bayesian method
The Bayesian approach considers the parameters you want to estimate as unknown constants. Each parameter is modelled as a random variable. The method takes its name from Bayes' rule and it lets you compute quantities which are not available in the Frequentist framework.
The Bayes' rule combines the experiment's results with any prior information available; however, A/B testing uses non-informative priors. By choosing the a priori distribution, we can leverage the posterior distribution to compute, for example, the variant's probability to improve upon the original.
Access your Bayesian results
When you click Results on the dashboard, you are taken to the classic Results page by default.
To access the results generated by Bayesian statistics, click the Actions menu at the top right of the page > Enable Bayesian.

You can't access the Bayesian results page in the following cases: 100% of your traffic is diverted to the original; the number of visitors to your experiment is 0.
The Bayesian results page
The Bayesian reporting page's structure is similar to the classic results page.
However, some elements are different:
- New indicators appear, such as the probability of beating the original variation and the results' reliability according to Bayes.
- Several graphs do not appear on the page and only the conversion rate is displayed.
A few definitions
Probability to beat the original
This is the probability that a variation will beat the original page with a higher conversion rate for a given goal.
When 0% of traffic is allocated to the original, the variations receive 100% of the traffic and do not compete with the original. In this case, we refer to the "Probability of being the winning variation".
Reliability of results according to Bayes
This corresponds to the results' confidence rate. This rate is calculated on a three-level scale. A legend is included in the Reliability column of the results table for easy interpretation. Results are totally reliable when the three boxes are full: this means that the reliability rate has stabilized over time. Be careful: to avoid any reversal of trends, it is advised to avoid exploiting your results before reaching a sufficient reliability rate.

Bayesian continuous metrics
When you hover over non-binomial metrics, such as Revenue per visit/visitor or Average cart value, an overlay appears.
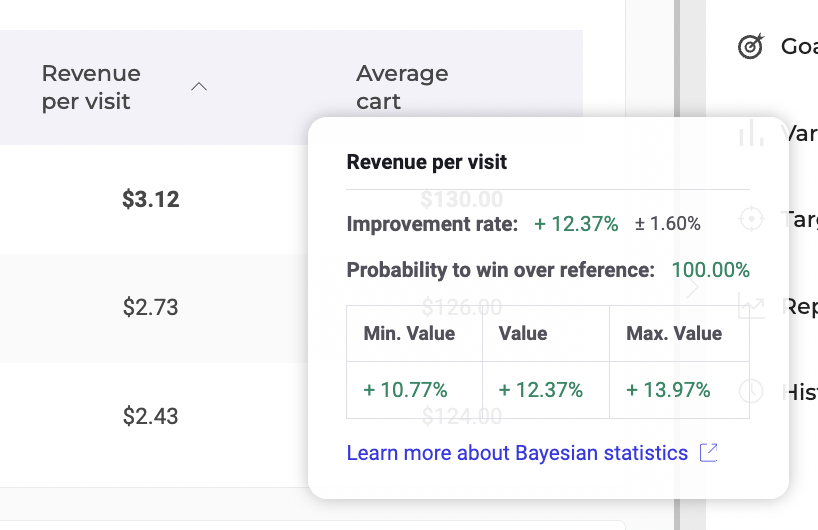
- Improvement rate: This value indicates the rate of improvement for the metric. It is displayed in green if positive and red if negative, alongside a credible interval.
- Probability to win over reference: This value shows the probability that the variation will outperform the control variation. It is displayed in green if it is higher than the reliability threshold set in the configuration; otherwise, it is red.
- Credible Interval Table: The min and max values are the bounds of the credible interval around the improvement rate. There is 95% chance for the improvement rate to be between those values. The values are displayed in green if they are positive, and in red when they are negative.
If you would like more details on how Kameleoon’s statistic engine works, you can read our Statistical paper.
My results are very different. Is it normal?
Both statistical methods lead to equivalent results, but they do not guarantee a perfect similarity between the two. It is therefore normal to observe differences between certain rates.
In some cases, two different variations can be declared winners on the same experiment.
Ensure confidence levels are at their maximum in both methods before comparing data. If they are, and there is still doubt, we recommend you use the classic method's results.
Further reading
If you would like more details on how Kameleoon’s statistic engine works, read our Statistical paper.