
A new campaign results page is available! Discover its features
What is statistical significance ?
Hypothesis testing
One cannot speak about statistical significance without speaking of hypothesis testing. When you launch an experiment within Kameleoon’s platform you want to know if the variation you are proofing is actually improving a certain metric compared to the original version of your site. When you frame this in statistical terms you can translate it by making a hypothesis which you will then try to refute by observing data.
To help you take a decision Kameleoon by default uses the frequentist statistical framework which helps us assess how likely it is to observe the data we observe if the “null” hypothesis is true. This is computed by the “p-value” which is exactly the probability of observing data at least as extreme under the null hypothesis, extreme meaning a wider gap in the metric of interest.
Statistical significance and reliability
An experiment is said to be statistically significant if the sample data we collected is sufficiently inconsistent with the data we should have observed under the null hypothesis.
To help you assess if an experiment result is statistically significant or not we do not provide the test p-value directly but the reliability which is simply computed as:
“reliability” = 1 – “p-value”
Example
Let’s take the example below:
- Reference variation: 142,000 unique visitors tested, 3.52% conversion rate (5,000 sales)
- Variation 1 – tested: 216,000 unique visitors tested, 3.64% conversion rate (1,850 sales)
In this example, we are testing if variation 1 is more efficient than the reference variation. We are trying to reject the null hypothesis which is that the reference is equally or less efficient than the variation. We feel confident in wrongly rejecting the null hypothesis in only 5 % of the case, hence we set our significance level at 0.05.
We now compute the reliability, we notice that variation 1 is more efficient than the reference variation and that the reliability is 96%: the outcome of the experiment is statistically significant at our significance level 5%.
Checking statistical significance
If you are using Google Analytics or Kameleoon as a reporting tool, Kameleoon will automatically calculate your experiment’s statistical significance, allowing you to check if one variation of your experiment is more or less effective than the reference.
Reliability
The Results page lets you check your campaign’s performance. There are multiple ways to check reliability.
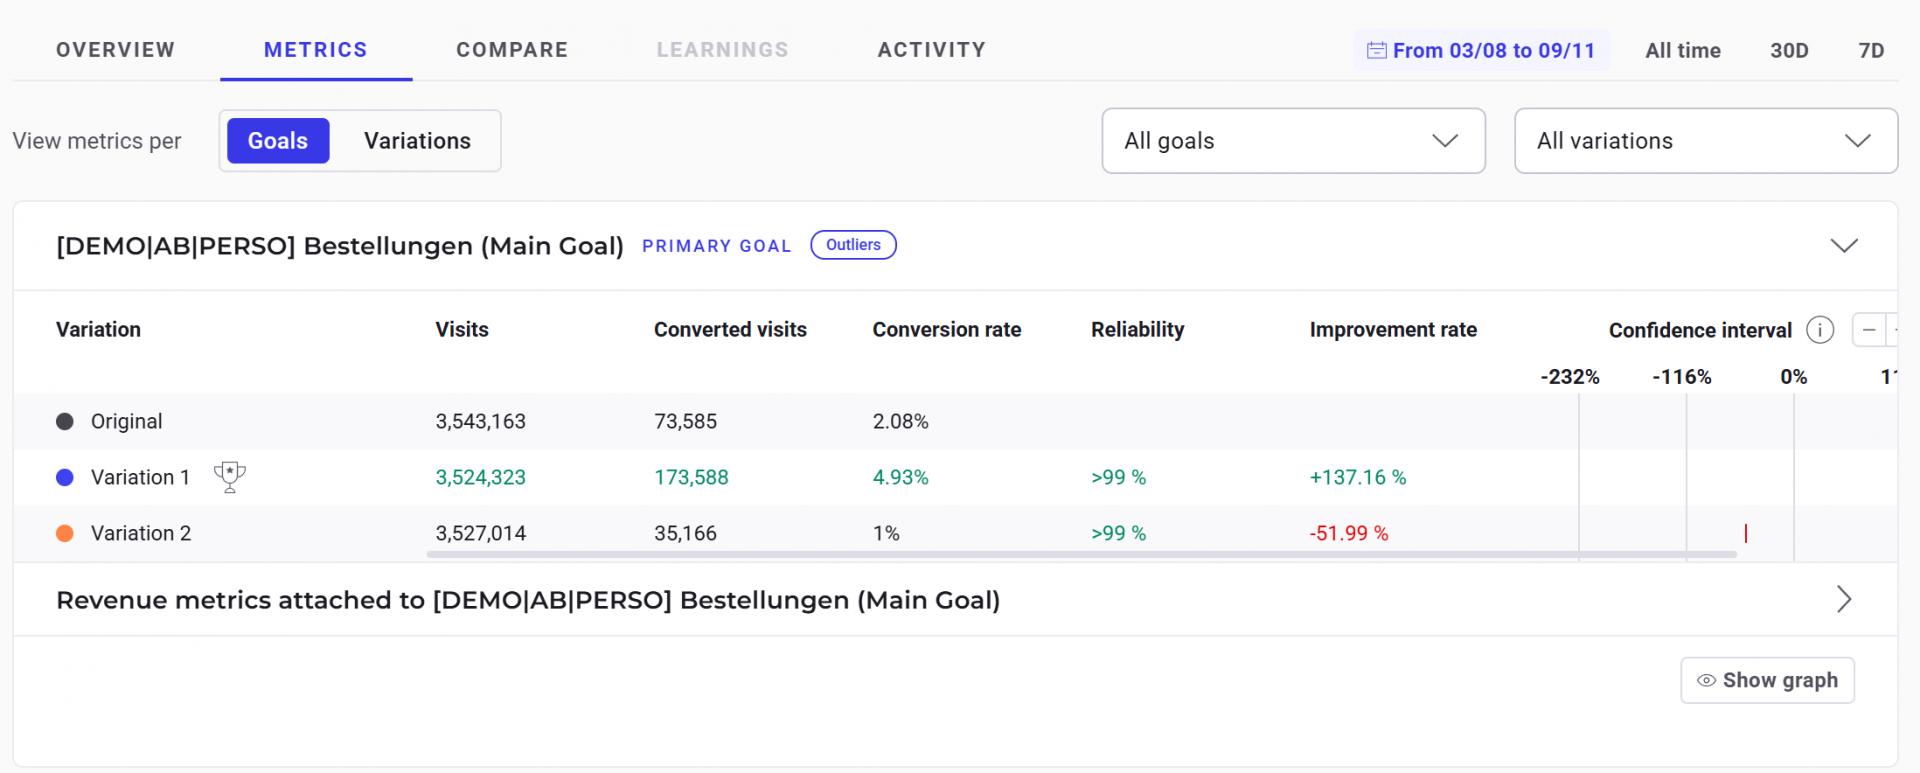
Primary goal
Your variation’s reliability rate relative to the primary goal is listed in the Primary goal section of the Overview menu.

Here, the reliability rate for both variations is >99%.
Charts
You can view a visual representation of reliability rate over time in the Charts section of the Overview menu.

You can select which variations are displayed using the dropdown menu (all variations are selected by default). You can also choose to view data by Day, Week, or Month. Hover over the chart to view more reliability rate data.
Metrics
Reliability rates are displayed in the Metrics menu. Click Goals or Variations to view reliability rate by goal or variation.
What can you do if sufficient reliability is not achieved?
If your reliability rate is stable but insufficient, this may be related to different factors. Among them:
- the traffic on the page is not sufficient;
- the difference between the performance of the original and the variation is too small to draw conclusions (for example, the modification you have made has a very small impact on the behavior of your visitors).
However, you can draw conclusions for your website from a reliability rate stabilized at 75%. If the traffic on the page is not sufficient, your reliability rate will probably not reach 95%. But the Kameleoon results page offers a wide variety of data and indicators that will allow you to better understand your audience.
Note: You can change the minimum reliability rate required for Kameleoon to consider that a variation is winning. To do so, go to the “Administrate” > “Sites” page in the Kameleoon App. In the tab dedicated to Experiments, you will be able to modify this minimum reliability rate.

Why do we see significant results in an A/A test?
In an A/A test, we expect the p-values to be uniformly distributed across all attached goals. Some goals may show no effect, while others may indicate a positive or negative effect purely due to random variation. This is a normal statistical outcome and does not necessarily indicate an issue.
It’s important to note that the more goals you attach to a test, the higher the likelihood of encountering false positives—results that appear statistically significant but are purely due to chance. Seeing some goals with a confidence level above 95% in an A/A test is not unusual and aligns with statistical expectations. This is known as the multiple comparisons problem: the more statistical tests you run, the higher the likelihood of observing at least one significant result.
A good way to gain reassurance is to rerun the A/A test while focusing on the primary goal. This helps confirm that any observed effects are simply random noise rather than a genuine impact.
Ultimately, A/A tests serve as a validation of the experimentation process, and occasional significant results do not necessarily indicate a flaw in the platform or methodology.
However, if the results appear overly skewed or unexpected, it’s worth checking for a Sample Ratio Mismatch (SRM)—a sign that traffic isn’t being split correctly, which could introduce bias. You can learn more about SRM and how to detect it here.
Further reading
If you would like more details on how Kameleoon’s statistic engine works, you can read our Statistical paper.
