
A new version of the Graphic Editor is currently being deployed, this documentation will be updated soon.
In this article:
– Step-by-step instructions for creating and launching your first A/B test or personalization campaign
– Best practices for setting up your experiment, including defining goals, selecting target audiences, and creating variations
– Tips for analyzing and interpreting the results of your experiment to make data-driven decisions
Once you’ve created your account and installed the Kameleoon script, you’ll be ready to create and launch your experiments! This article will guide you step by step towards the launch of your first experiment.
Launch Kameleoon
You can create variations of your web pages and launch and manage experiments using Kameleoon’s editing mode.
Via your website
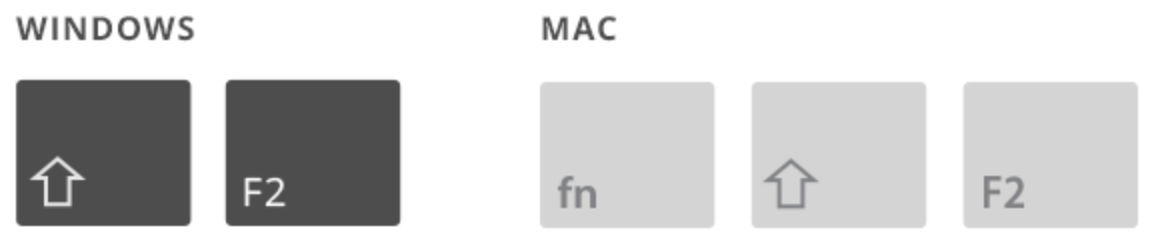
To launch Kameleoon, you need to access one of the web pages where you have installed the Kameleoon script and press Shift + F2 or Fn + Shift + F2 (for Mac users).
If nothing happens, you can try another method to launch Kameleoon by adding the code “#kameleoon=true” to the end of the URL.
For example, this would make your URL:
https://www.website.com#kameleoon=true
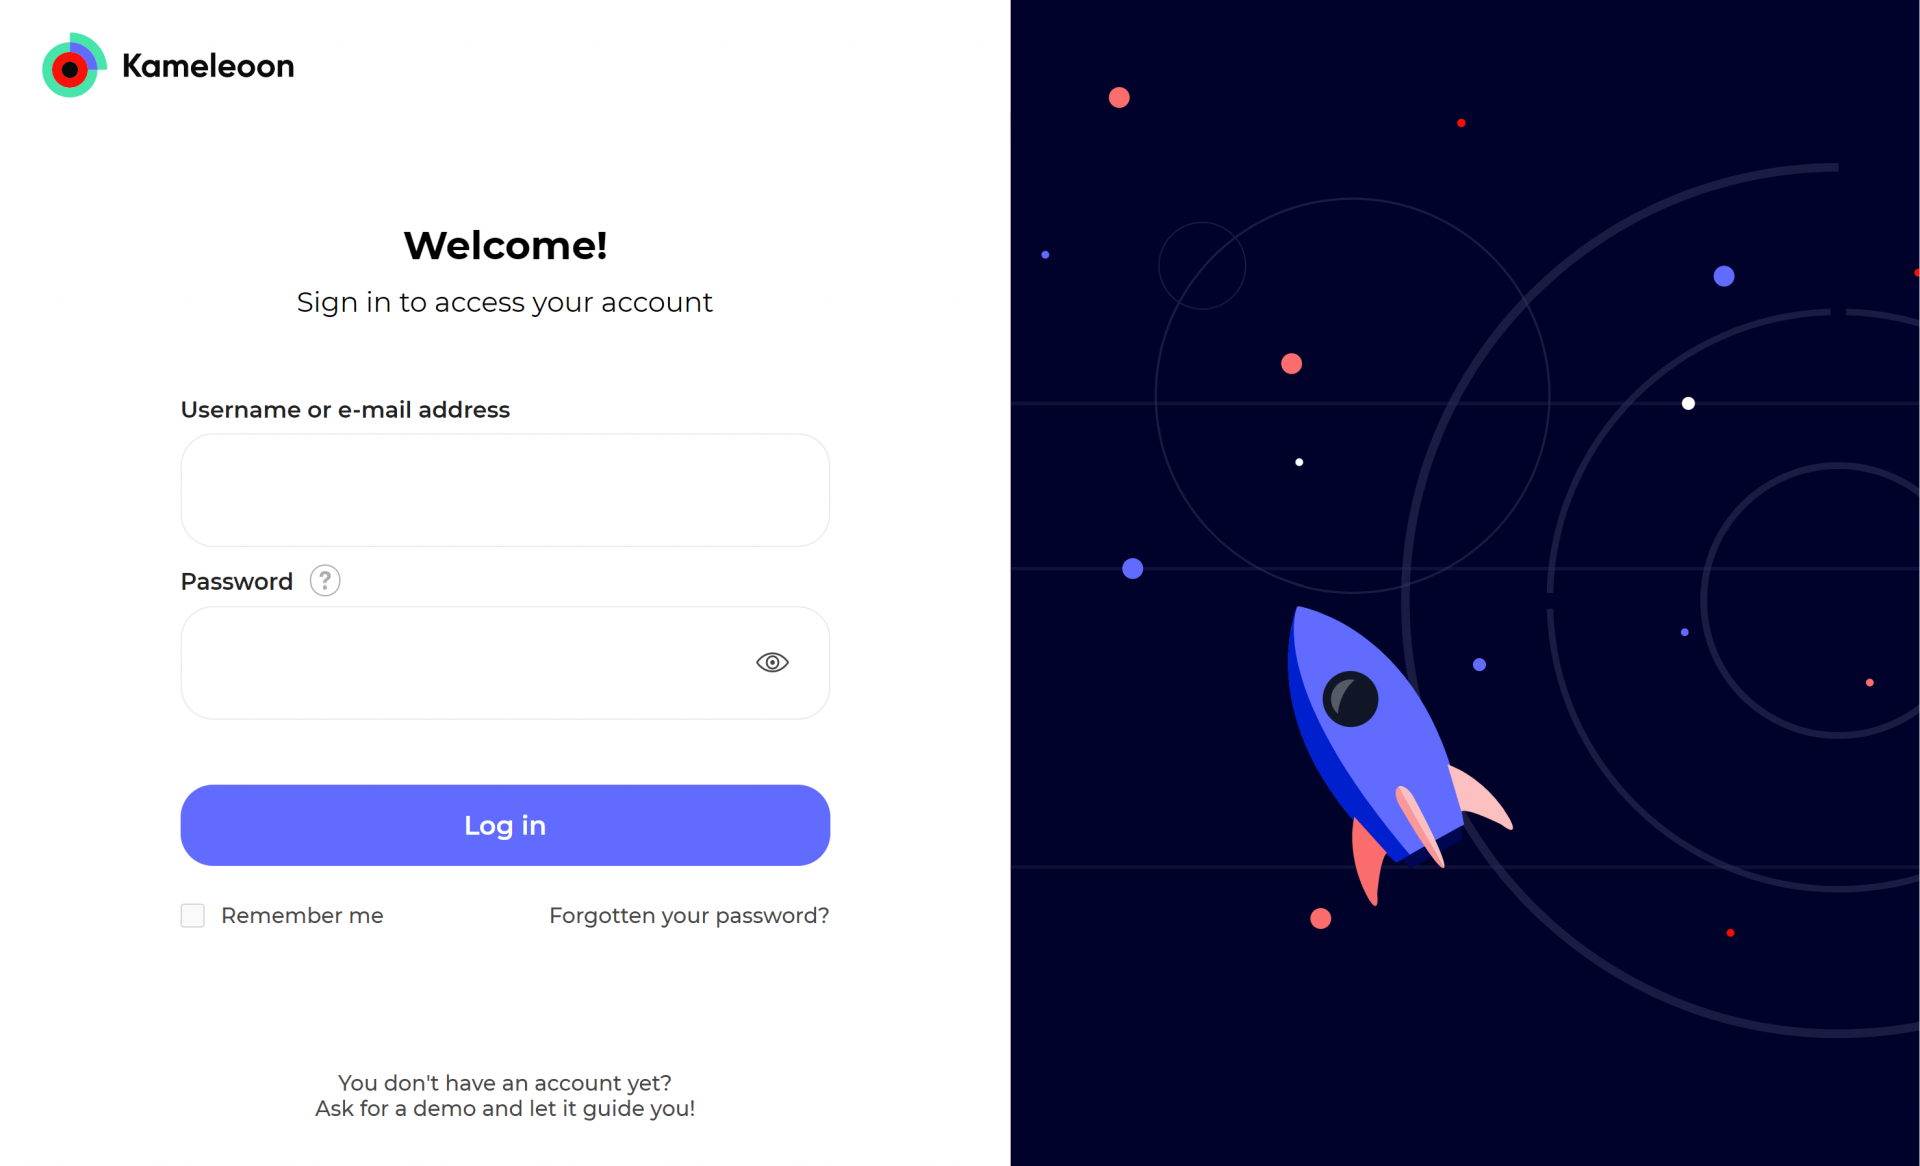
Once Kameleoon has loaded, you will open a login pop-in and enter your username and password to access the editor.
You can then choose the type of experiment you want to create.
When the Graphic editor opens, you will see a header above the web page.
Via your App
You can also launch the editor by logging in to the Kameleoon App and clicking on the New experiment button.

Create an experiment
New classic A/B experiment
When Kameleoon has loaded, a pop-in will open, inviting you to choose between creating a new classic A/B experiment or a multivariate test, and opening an existing one.

We choose to create a new classic A/B experiment.
Name your experiment in the pop-in. You can also add a small description and tags to your experiment. Then click on Validate.

The Kameleoon header appears above your website: you are now able to create your variation!

When you are creating a new experiment, two variations are automatically created:
- Original: this is your original page without any changes. You cannot change or delete this variation as it is the one used as a reference for your experiment.
- Variation 1: this variation is a copy of your page, on which you can change whatever you want to. You can create and delete as many variations as you need but it is impossible to delete all of them because you’ll always need to have at least one variation. You can click on the name of a variation to open a menu and access advanced options, such as duplication, addition of CSS or JavaScript code, etc.
For further information about variations, please read our article Manage your experiments.
Edit an element
To change an element on the page, select the element using the cursor. A selection frame will help you to select it easily.

Once you have selected the element, an editing panel will appear on the left of the screen, consisting of 3 tabs: Style, Position and Tracking.

Each tab will present the most common and likely changes. To see all available tools, click on the More options button.
You can read our articles on the subject to learn more about the Graphic editor.
Validate your choice to apply it to the selected element.
You now have a new variation ready to use in an experiment.
Launch the experiment
Once you have created the new variation, you are ready to launch the experiment. This step will only be possible if you have correctly installed the Kameleoon script on your website.
Click on the Finalize button on the right of the header to launch the experiment.

A page will open, allowing you to configure and launch the experiment.

To launch the experiment, simply follow the steps on your screen:
- 1st step: Choose the visitors targeted by your experiment. By default, the experiment will launch on the current page without any specific targeting, and the traffic will be equally split between your variation(s) and the original page.
- 2nd step: Select the variation to include in the experiment by checking the corresponding box. If you have created several variations, you can select as many as you want to. To launch an experiment , you must select at least one variation.
- 3rd step: Choose one or several goal(s), and/or a reporting tool. Only Kameleoon’s reporting tool is configured with your account by default, but you can add other reporting tools to your Kameleoon App.
- 4th step (optional but strongly recommended): Simulate your experiment to check its settings.

Targeting
During the second step of the finalization, you need to define the targeting. Choose the visitors to target for the experiment. By default, all the visitors who visit the page on which you’ve created your experiment will be exposed.

You can target by web page or segment. If you choose a segment targeting, select an existing segment or create a new one. If you choose to create a new one, the creation pop-in will enable you to choose the targeting conditions that will make up your segment.
To learn more about targeting, you can read our article Manage your targeting segments.
Traffic allocation
Select the variation(s) to include in the experiment by checking the corresponding box(es).
Two types of views are available: the list and the graph.

The original is automatically included in the experiment.
By default, the experiment will start on the current page, all visitors included, and the traffic will be distributed equally between your variation and the original page.
To change the traffic allocation, click and drag the slider of a variation by holding the click, or directly enter the percentage by clicking on the number displayed on the right of the slider. Any unassigned percentage of your traffic will automatically be considered as Traffic excluded.
Goals and integrations
You need to add at least one goal or tracking tool to be able to launch your experiment.
Goals
You must also configure one or several goal(s). The first goal Engagement is automatically configured by default and informs you whether the visitor visited other pages after the landing page. Engagement can be defined as the opposite of bounce rate.
You can configure new goals to analyze the access rate to a page, number of page views, time spent on the page and any other custom goal. To do so, go to the Goals page in your Kameleoon App.
You also can configure a click tracking directly from the Graphic editor. To learn how to use this feature, please read our documentation about click tracking.
Once you have created your goals, all you need to do is wait for enough visitors to access your website before you can read and analyze the results. To find out more, read How long does an experiment last?
Integrations (tracking tools)
To analyze your experiments, several reporting tools are available. Kameleoon can be integrated with all major web analytics solutions (Google Analytics, AT Internet, Webtrends, Adobe Analytics (Omniture), Eulerian, etc.).
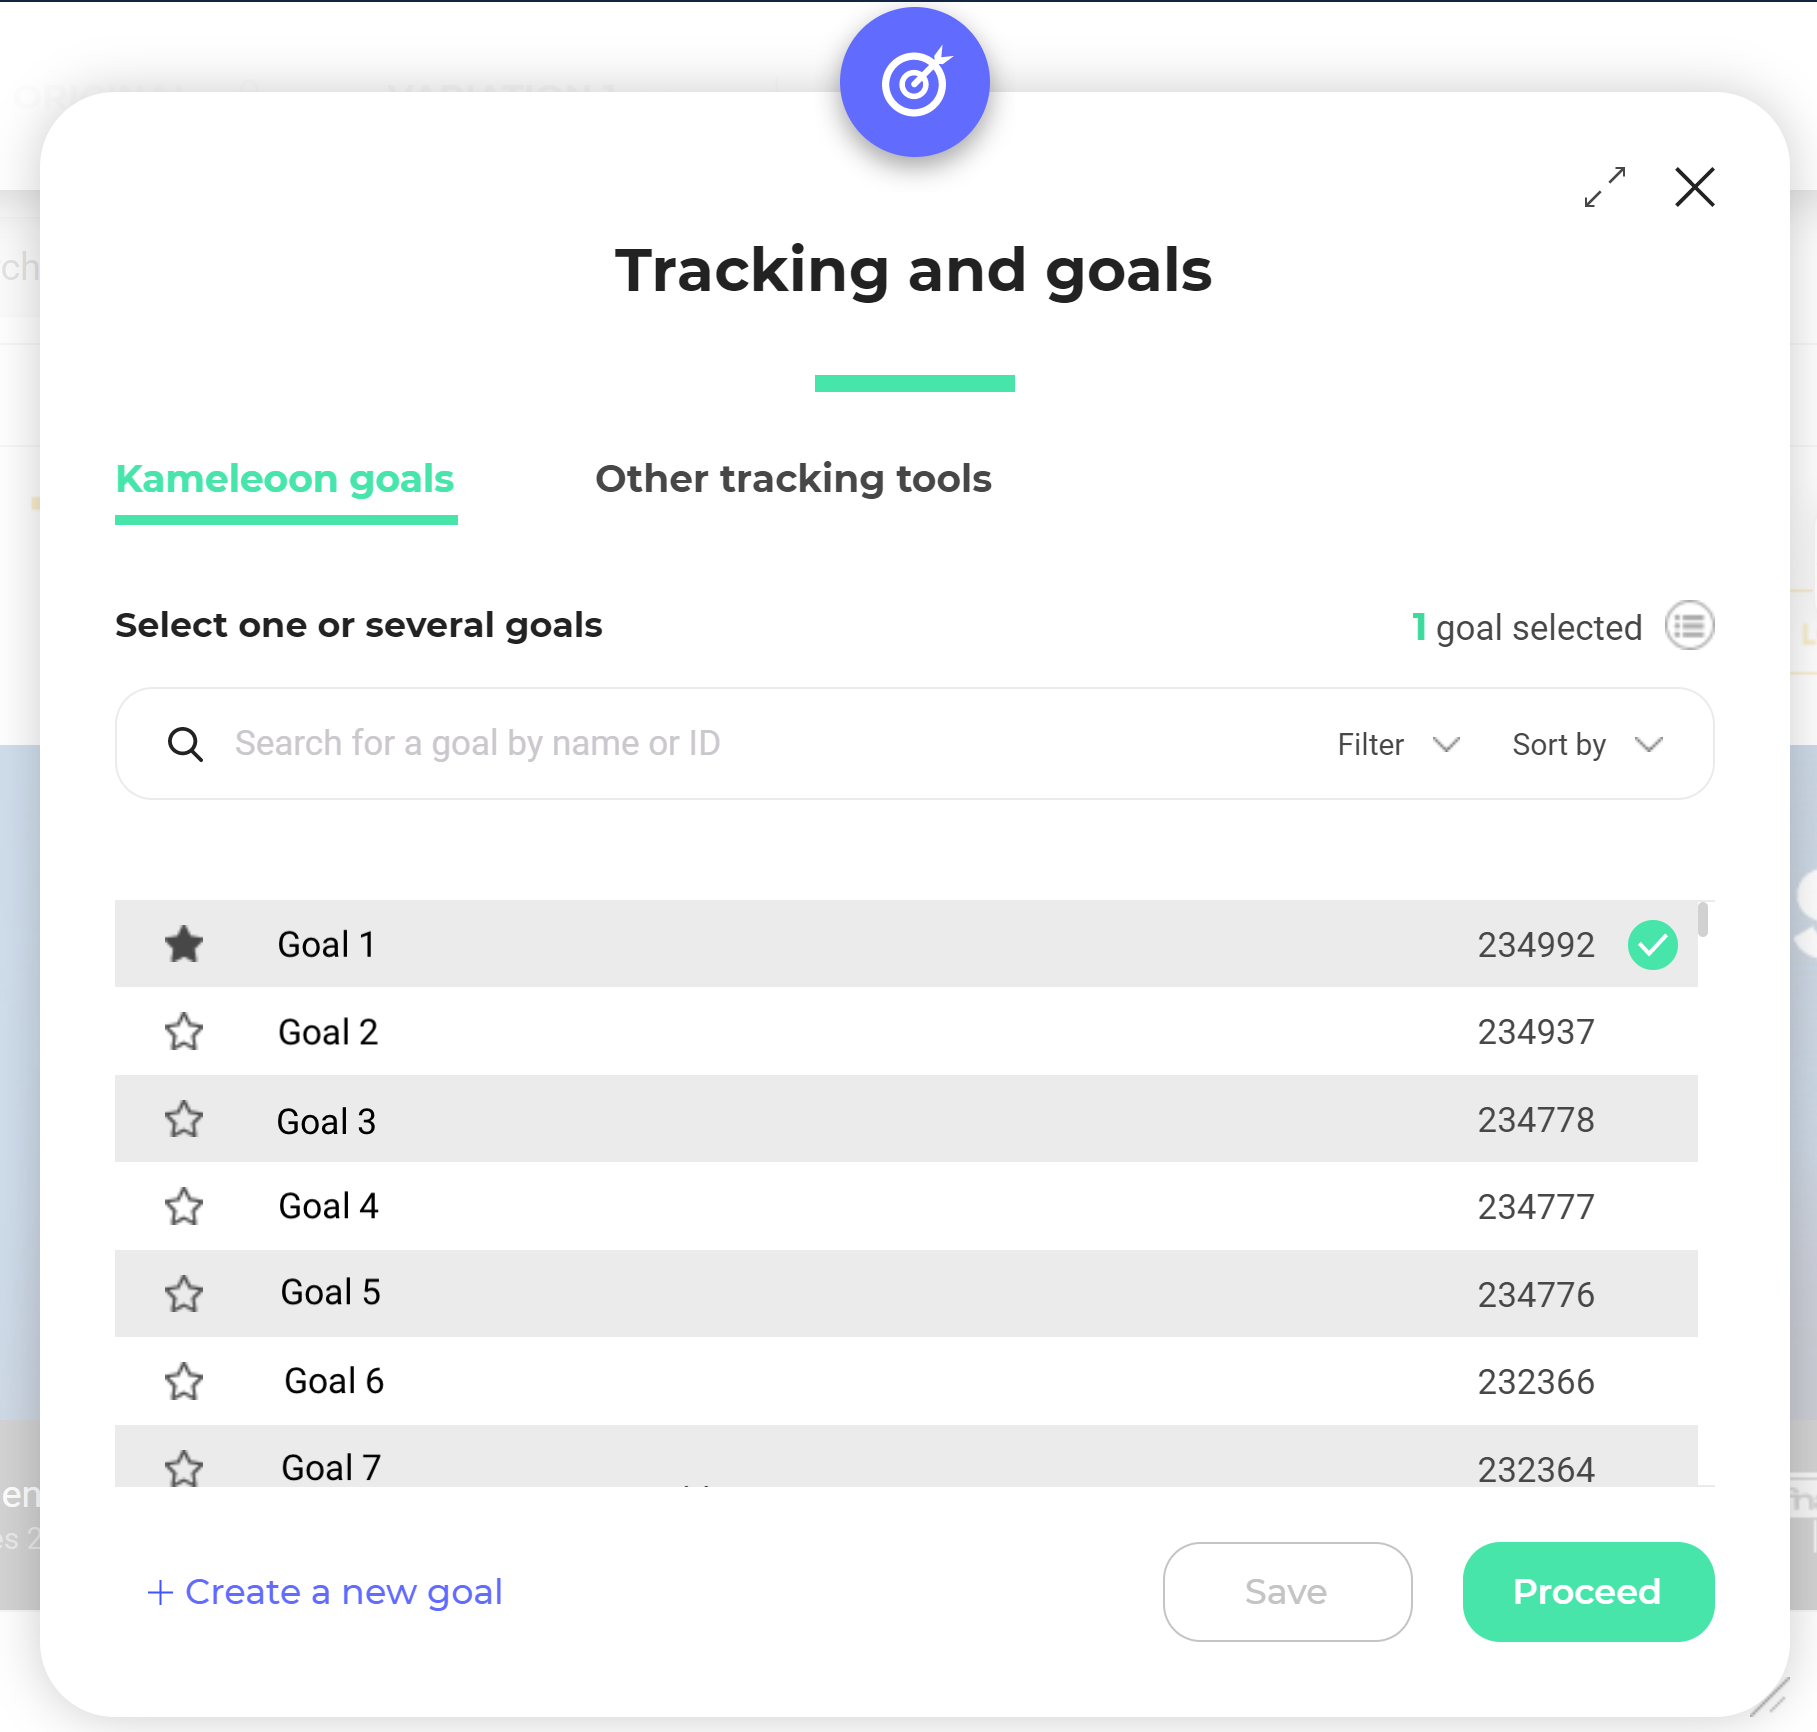
Kameleoon also offers its own reporting tool, which is configured by default with your account. To use the Kameleoon reporting tool, select the first tab of the pop-in, then choose your main goal. To create a goal, click on the Create a new goal button or follow the steps as described in the next paragraph.
In the Other tracking tools tab, if your reporting tool is not on the list, please read our documentation on Integrations to add a new web analytics solution.
Simulation
This step is optional but highly recommended. You can simulate the experiment to check its settings.
Click on the simulation: the page on which you have created your experiment will open in a new tab. The lower half of the page will display the simulation panel.

If you make changes to your experiment , don’t forget to simulate again.
For further information about simulation, you can read our article on the subject.
Launch
Upon finalizing each of these steps, you will see a green check icon and a summary of the chosen parameters. You must have completed all three steps in order to run the experiment.
Click on the Launch button to launch the experiment.

The last step before launching your experiment: a recap will be displayed, enabling you to check that everything is fine.
Click on Launch to confirm and launch your experiment.
A pop-in will confirm the launch.
Note: There may be a short latency time (up to 10 minutes) between the launching of an experiment and its visibility on the website. So don’t worry if your experiment does not appear immediately!
Results
Access to results
Log in to the Kameleoon App and access the Experiments page to view and analyze the results of the experiment.
In the left-hand side menu, click on Activate > Experiments.

Click the Results button on the line for the experiment.

Understanding the results
The results of your experiment will be displayed.
Main results
You’ll find the main results of your experiment at the top of the results page. You’ll be able to see at a glance which variation of your experiment is the winning one.

The information displayed here will depend on the results and progress of your experiment. You may encounter 4 different situations:
- It is too early to exploit the results;
- A variation is winning;
- A variation is recommended;
- The recommended variation is the original one.
Side panel
You can view and edit the settings of the experiment in the side panel of the results page.

General actions
At the top of the results page, to the right of the main information for the experiment, you’ll find the general actions menu:
- Refresh data
- Reset data
- Customize view
- Save display settings
- Create alerts
- Export
- Share
- Enable bayesian

Comparative view
Use the comparative view to compare improvement rates on each goal, on a spider web graph. It is only available if at least two goals are configured on your experiment.

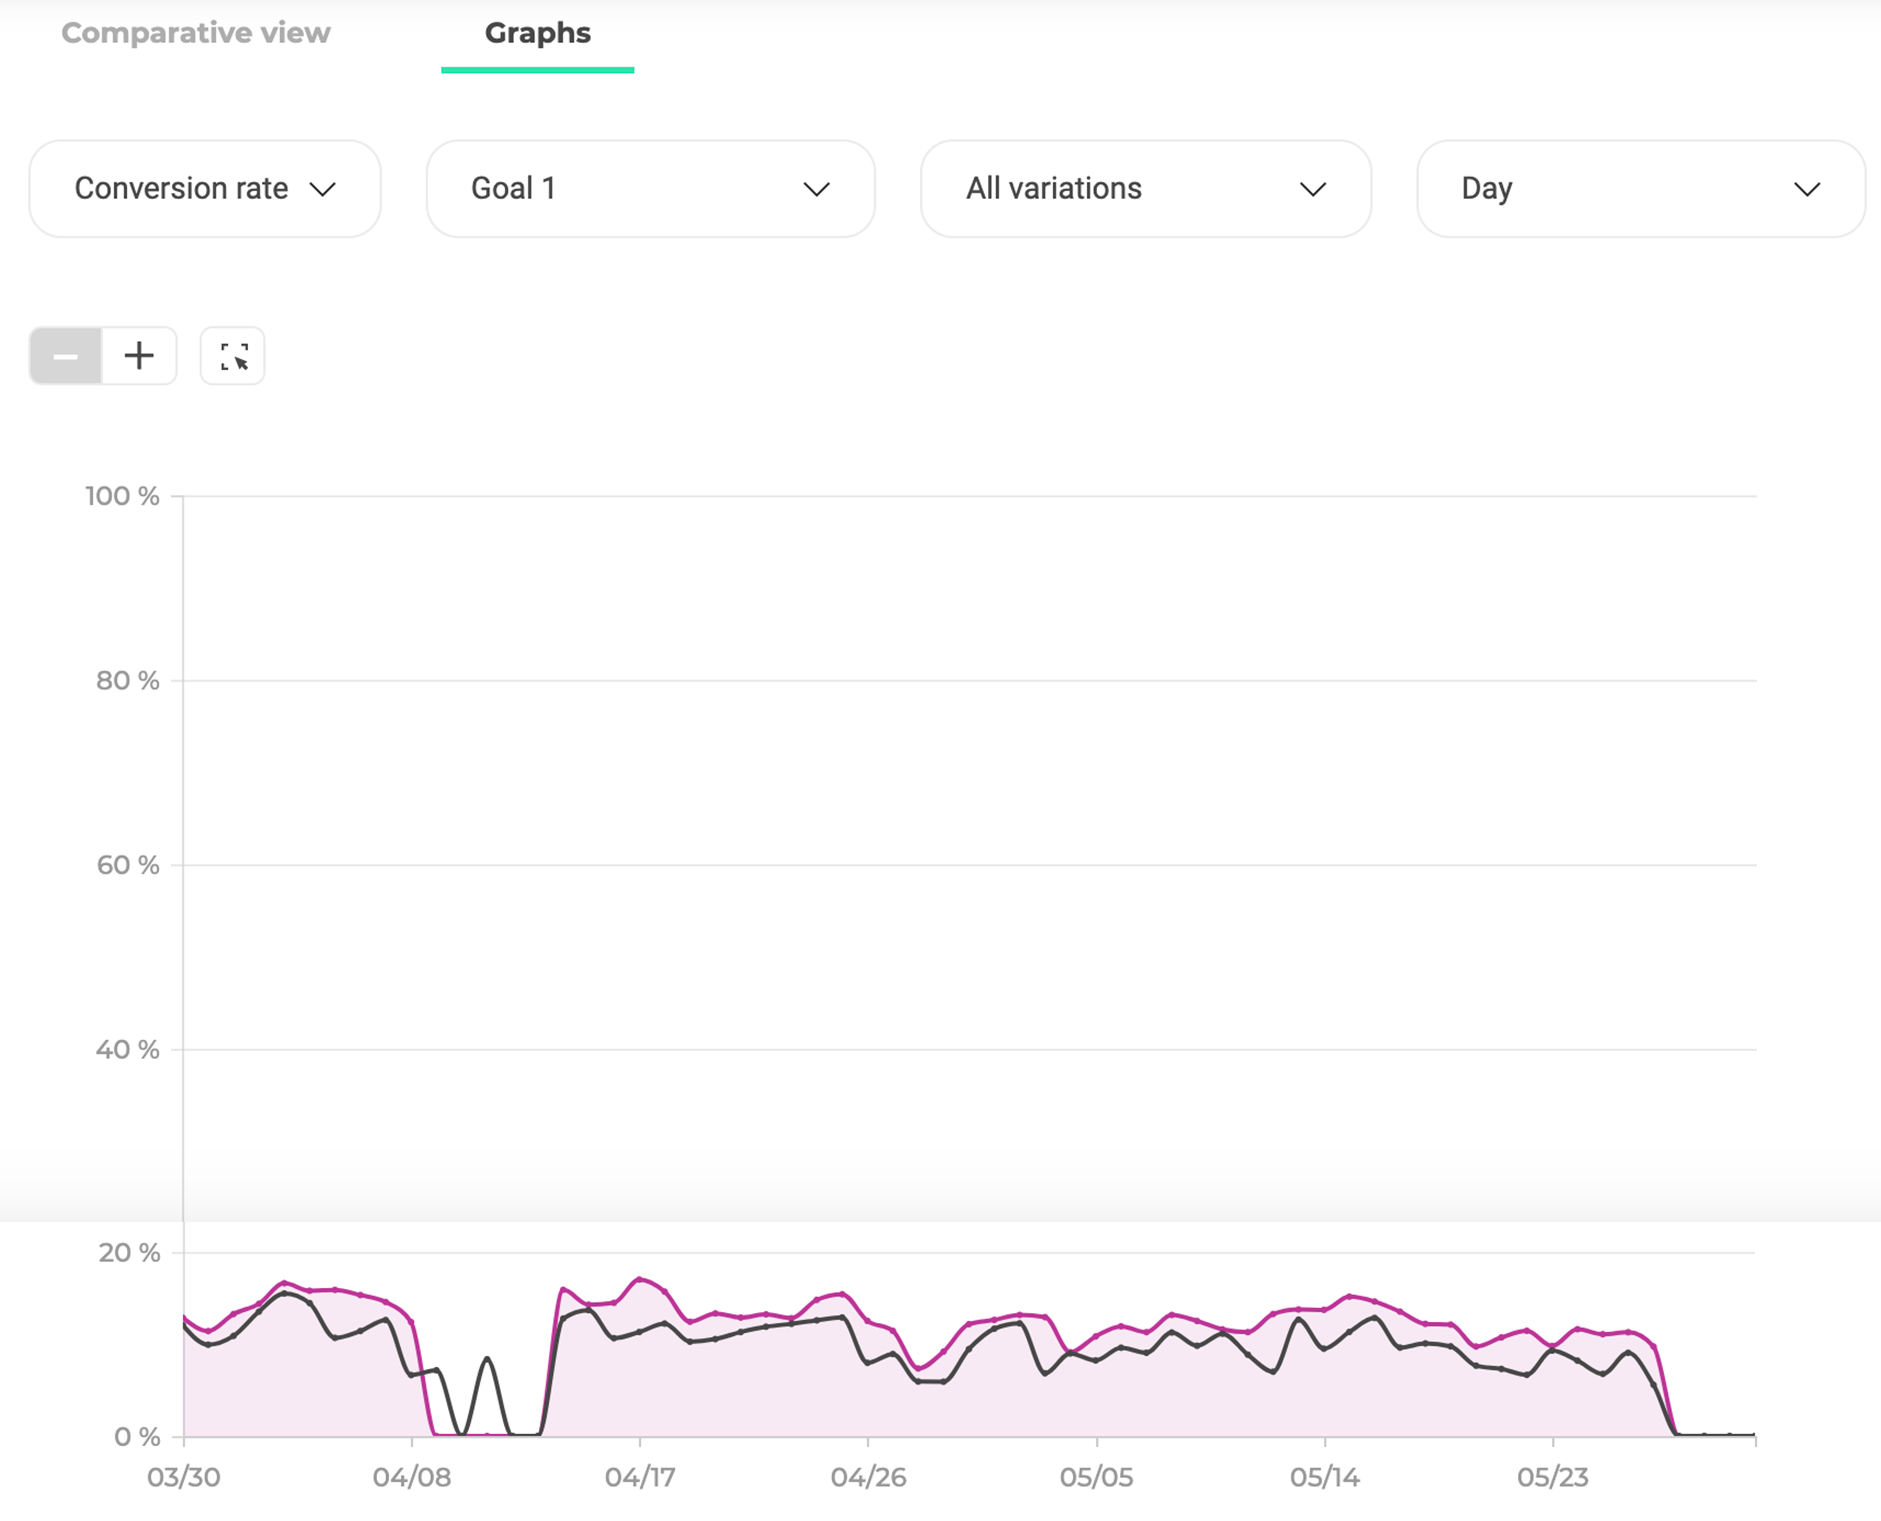
Graph
With this graph, you can view the evolution of the data over time. The x-axis displays the time scale and the y-axis displays the value of the data.
Tables
To provide you with more details, we display a table similar to the one below at the bottom of the page. With this table, you have a detailed view of experiment results either by variation or by goal. We offer ventilation tools, filters, and customization options for the display to facilitate the visualization.

You can click on the menu linked to each variation via a small icon.

You can change the traffic allocation or redirect all visitors to the top-performing version of the page.
For further information about the results of your experiments with Kameleoon, you can read our documentation about the results page.
