Audiences — Segment analysis
Kameleoon’s Audiences feature enables in-depth analysis of your main segments and measures the impact of experiments and personalization campaigns on those segments. This article explains how to explore segment analysis, interpret its key components, and refine your insights using filters and customization options
What you'll find in the segment analysis section
The segment analysis section of the Audiences page presents data through three main components:
- A bar chart that visualizes the performance and size of each segment.
- A segmentation table that provides detailed statistics about each segment.
- A filtering side panel to narrow down the data you’re analyzing.
This view enables data-driven comparisons of different audience segments based on metrics like visit volume, conversion rate, average cart value, and revenue.
Scope selection
At the top of the page, you can choose between analyzing data by Visitor or Visit using the dropdown menu. This lets you adjust how metrics are calculated across segments.
You must add the segments you want to track during the Audiences setup to ensure they appear here. For more information see our Getting started with Audiences and Segment builder articles.
Which segments are displayed?
The segments shown in this section are:
- The segments you selected during Audiences configuration, in the Include primarily section of the Configuration > Audiences tab.
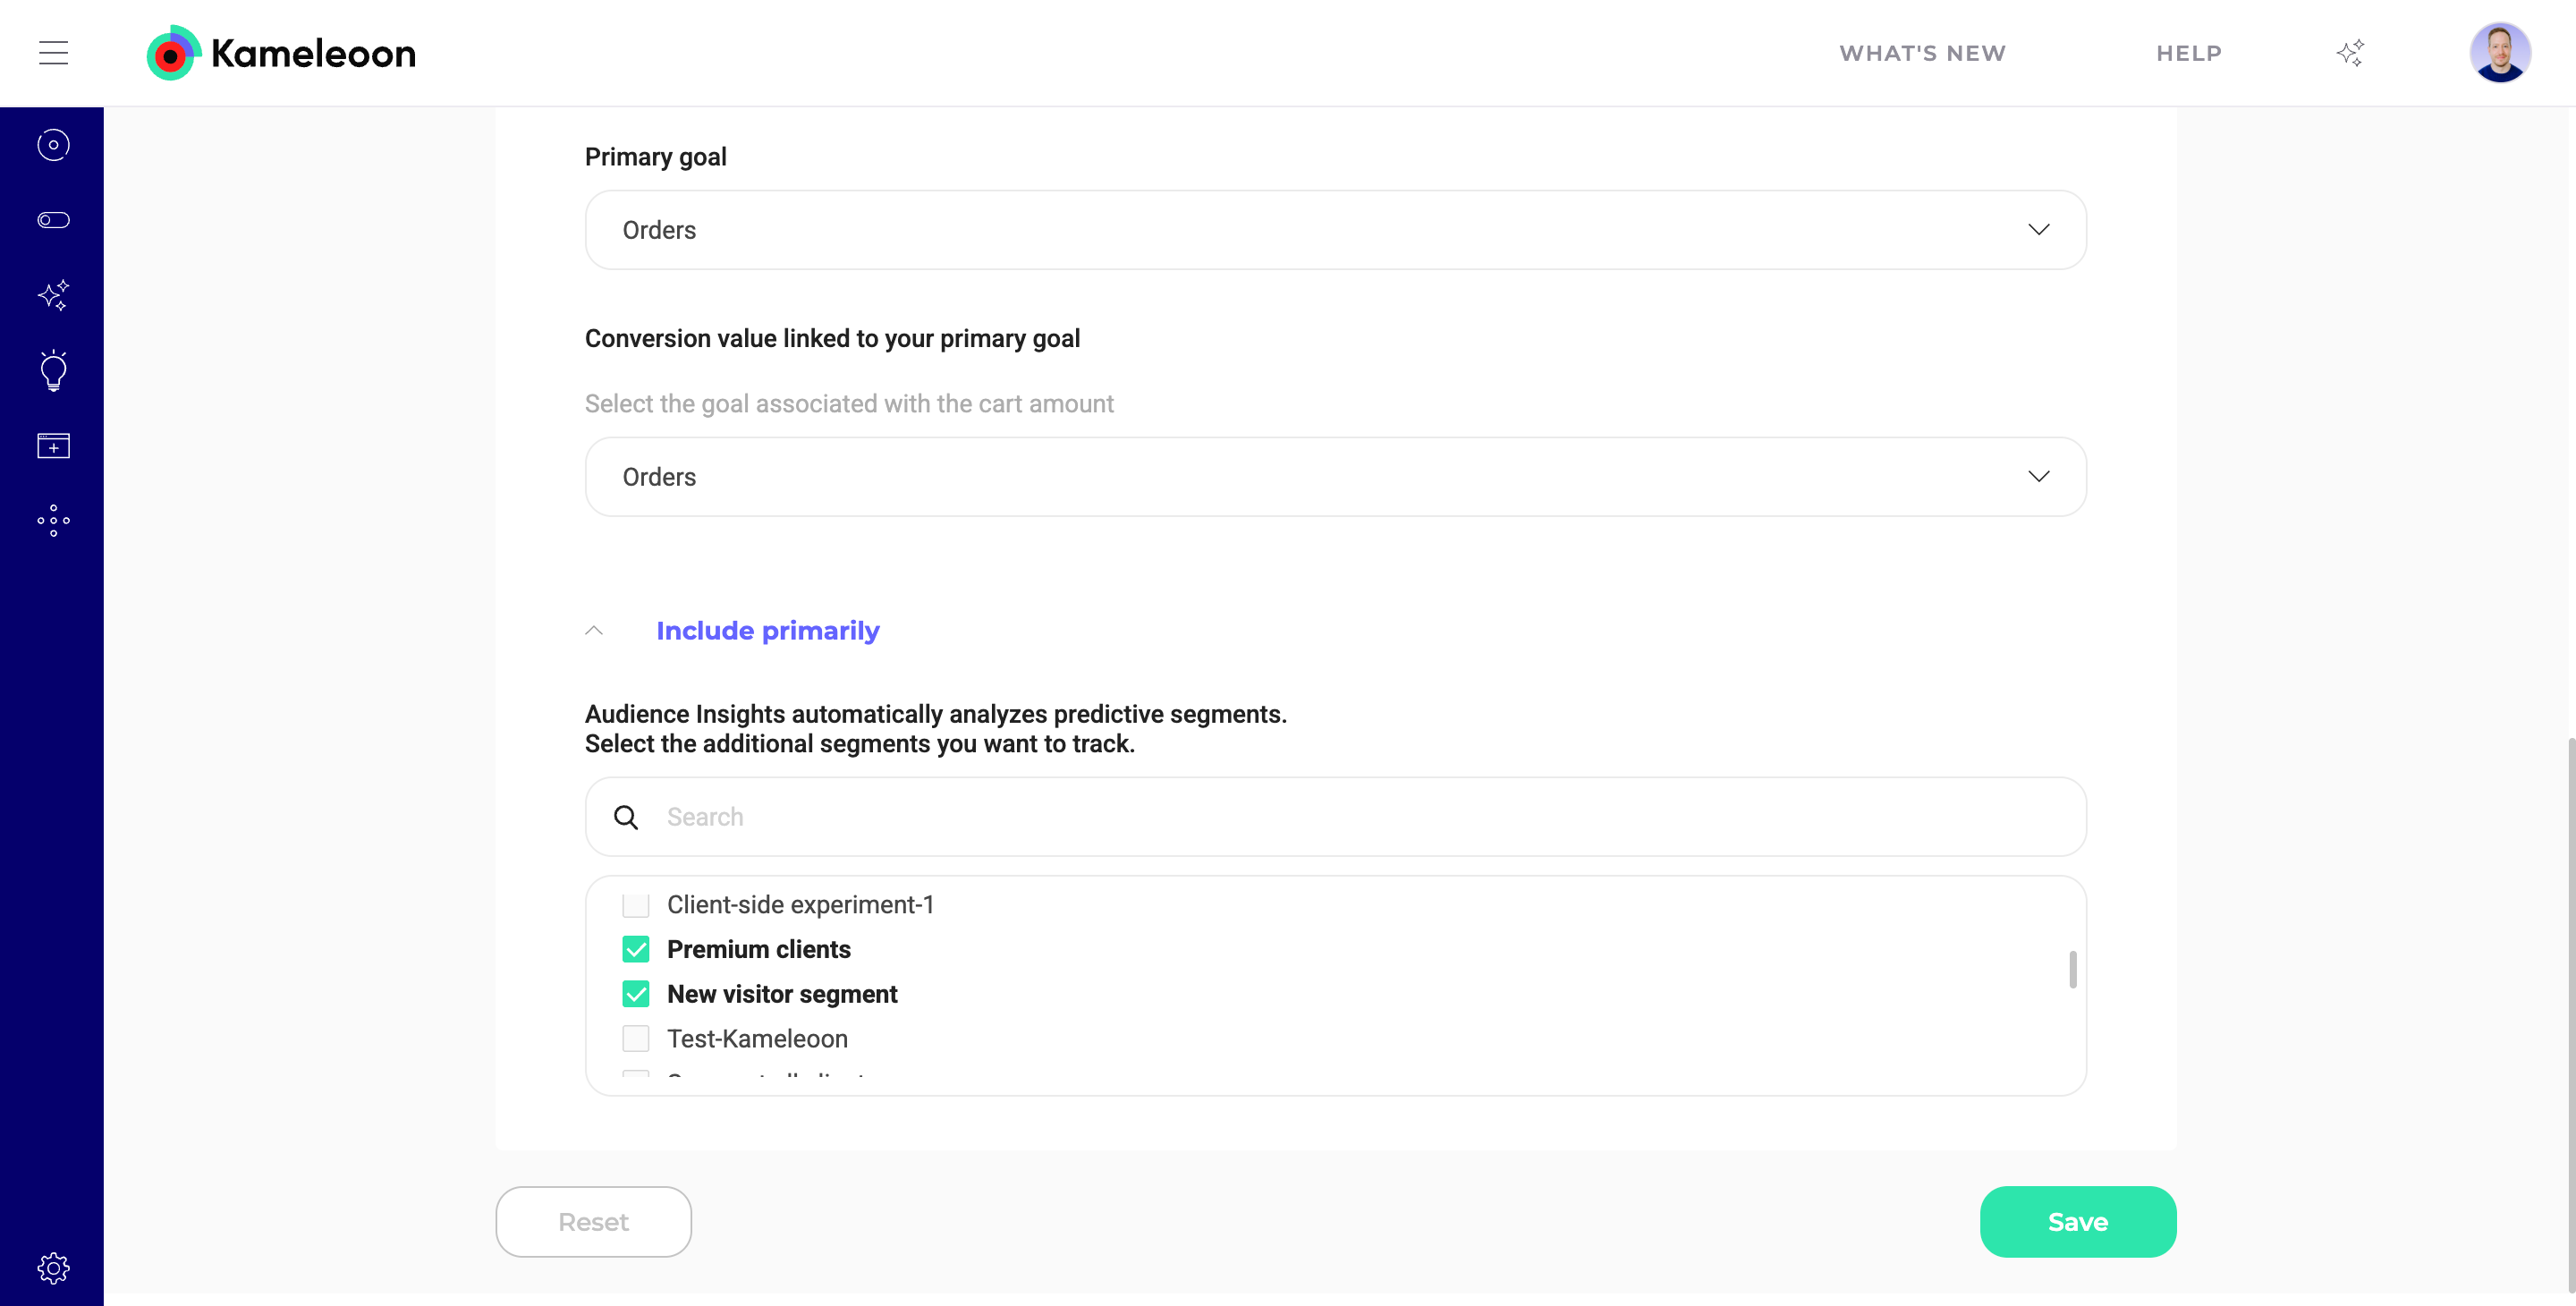
- You can also choose segments when you first set up Audiences for a project in the Select the segments you want to track step. For more information, refer to this article.
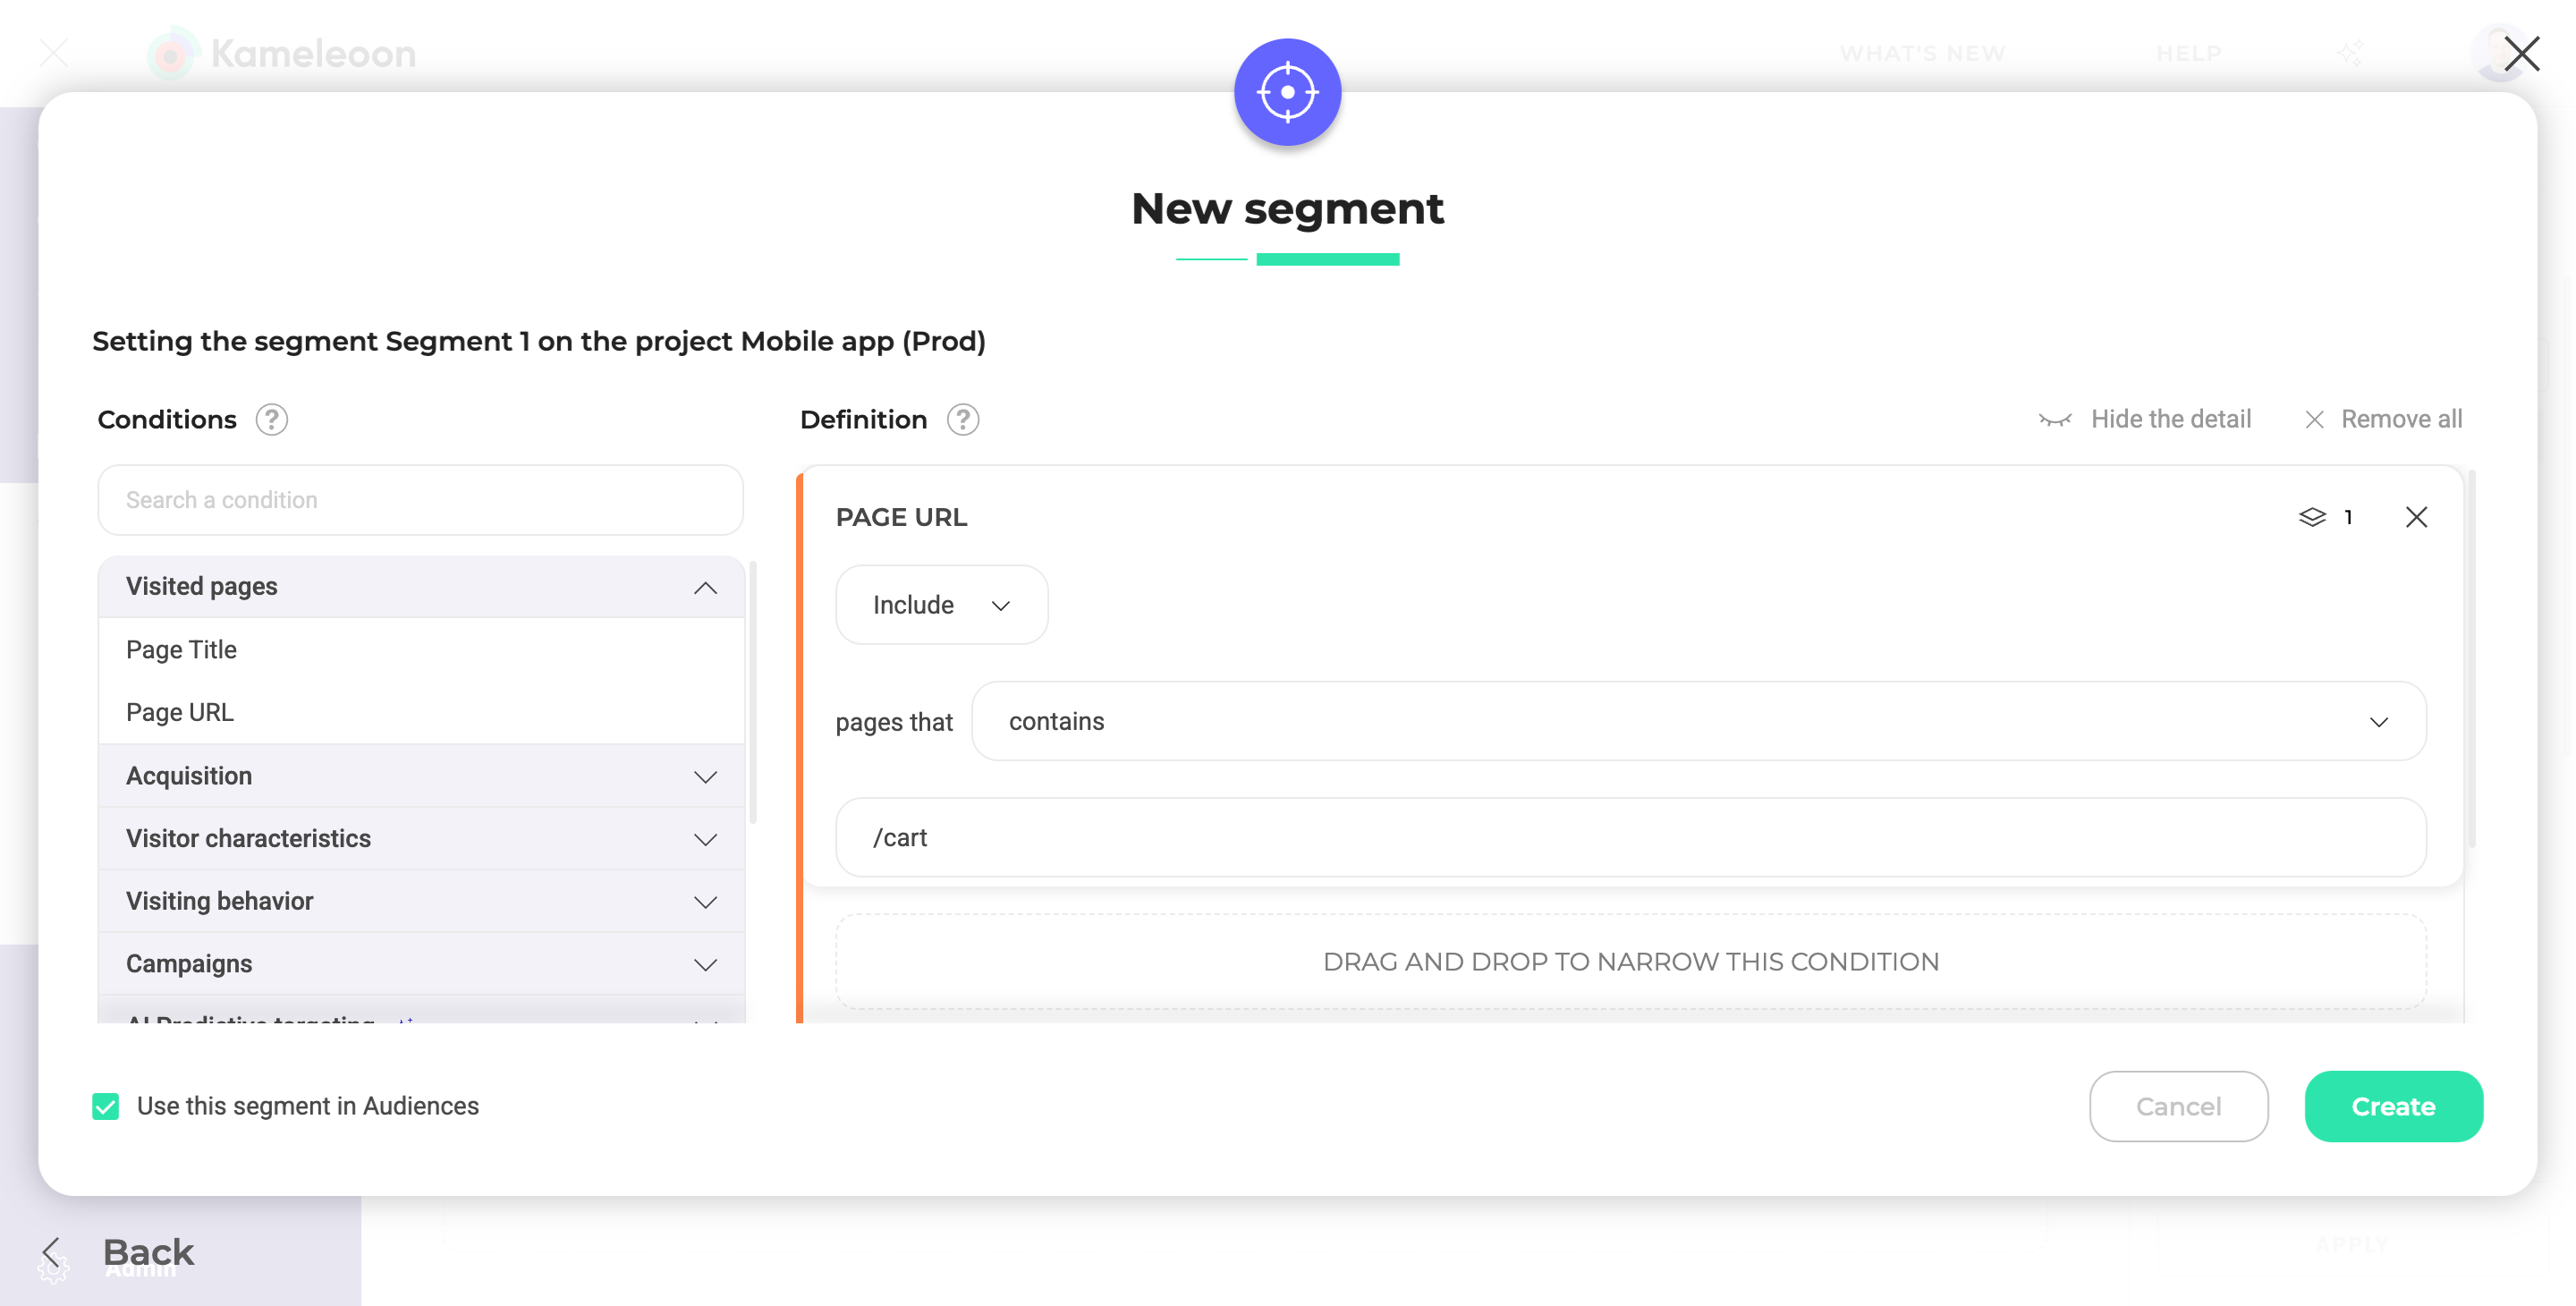
- The segments you included manually when creating them by selecting Use this segment in Audiences.
- Predictive segments, which automatically appear if you have the AI Predictive Targeting add-on and use AI Predictive Targeting conditions such as Likelihood to convert.
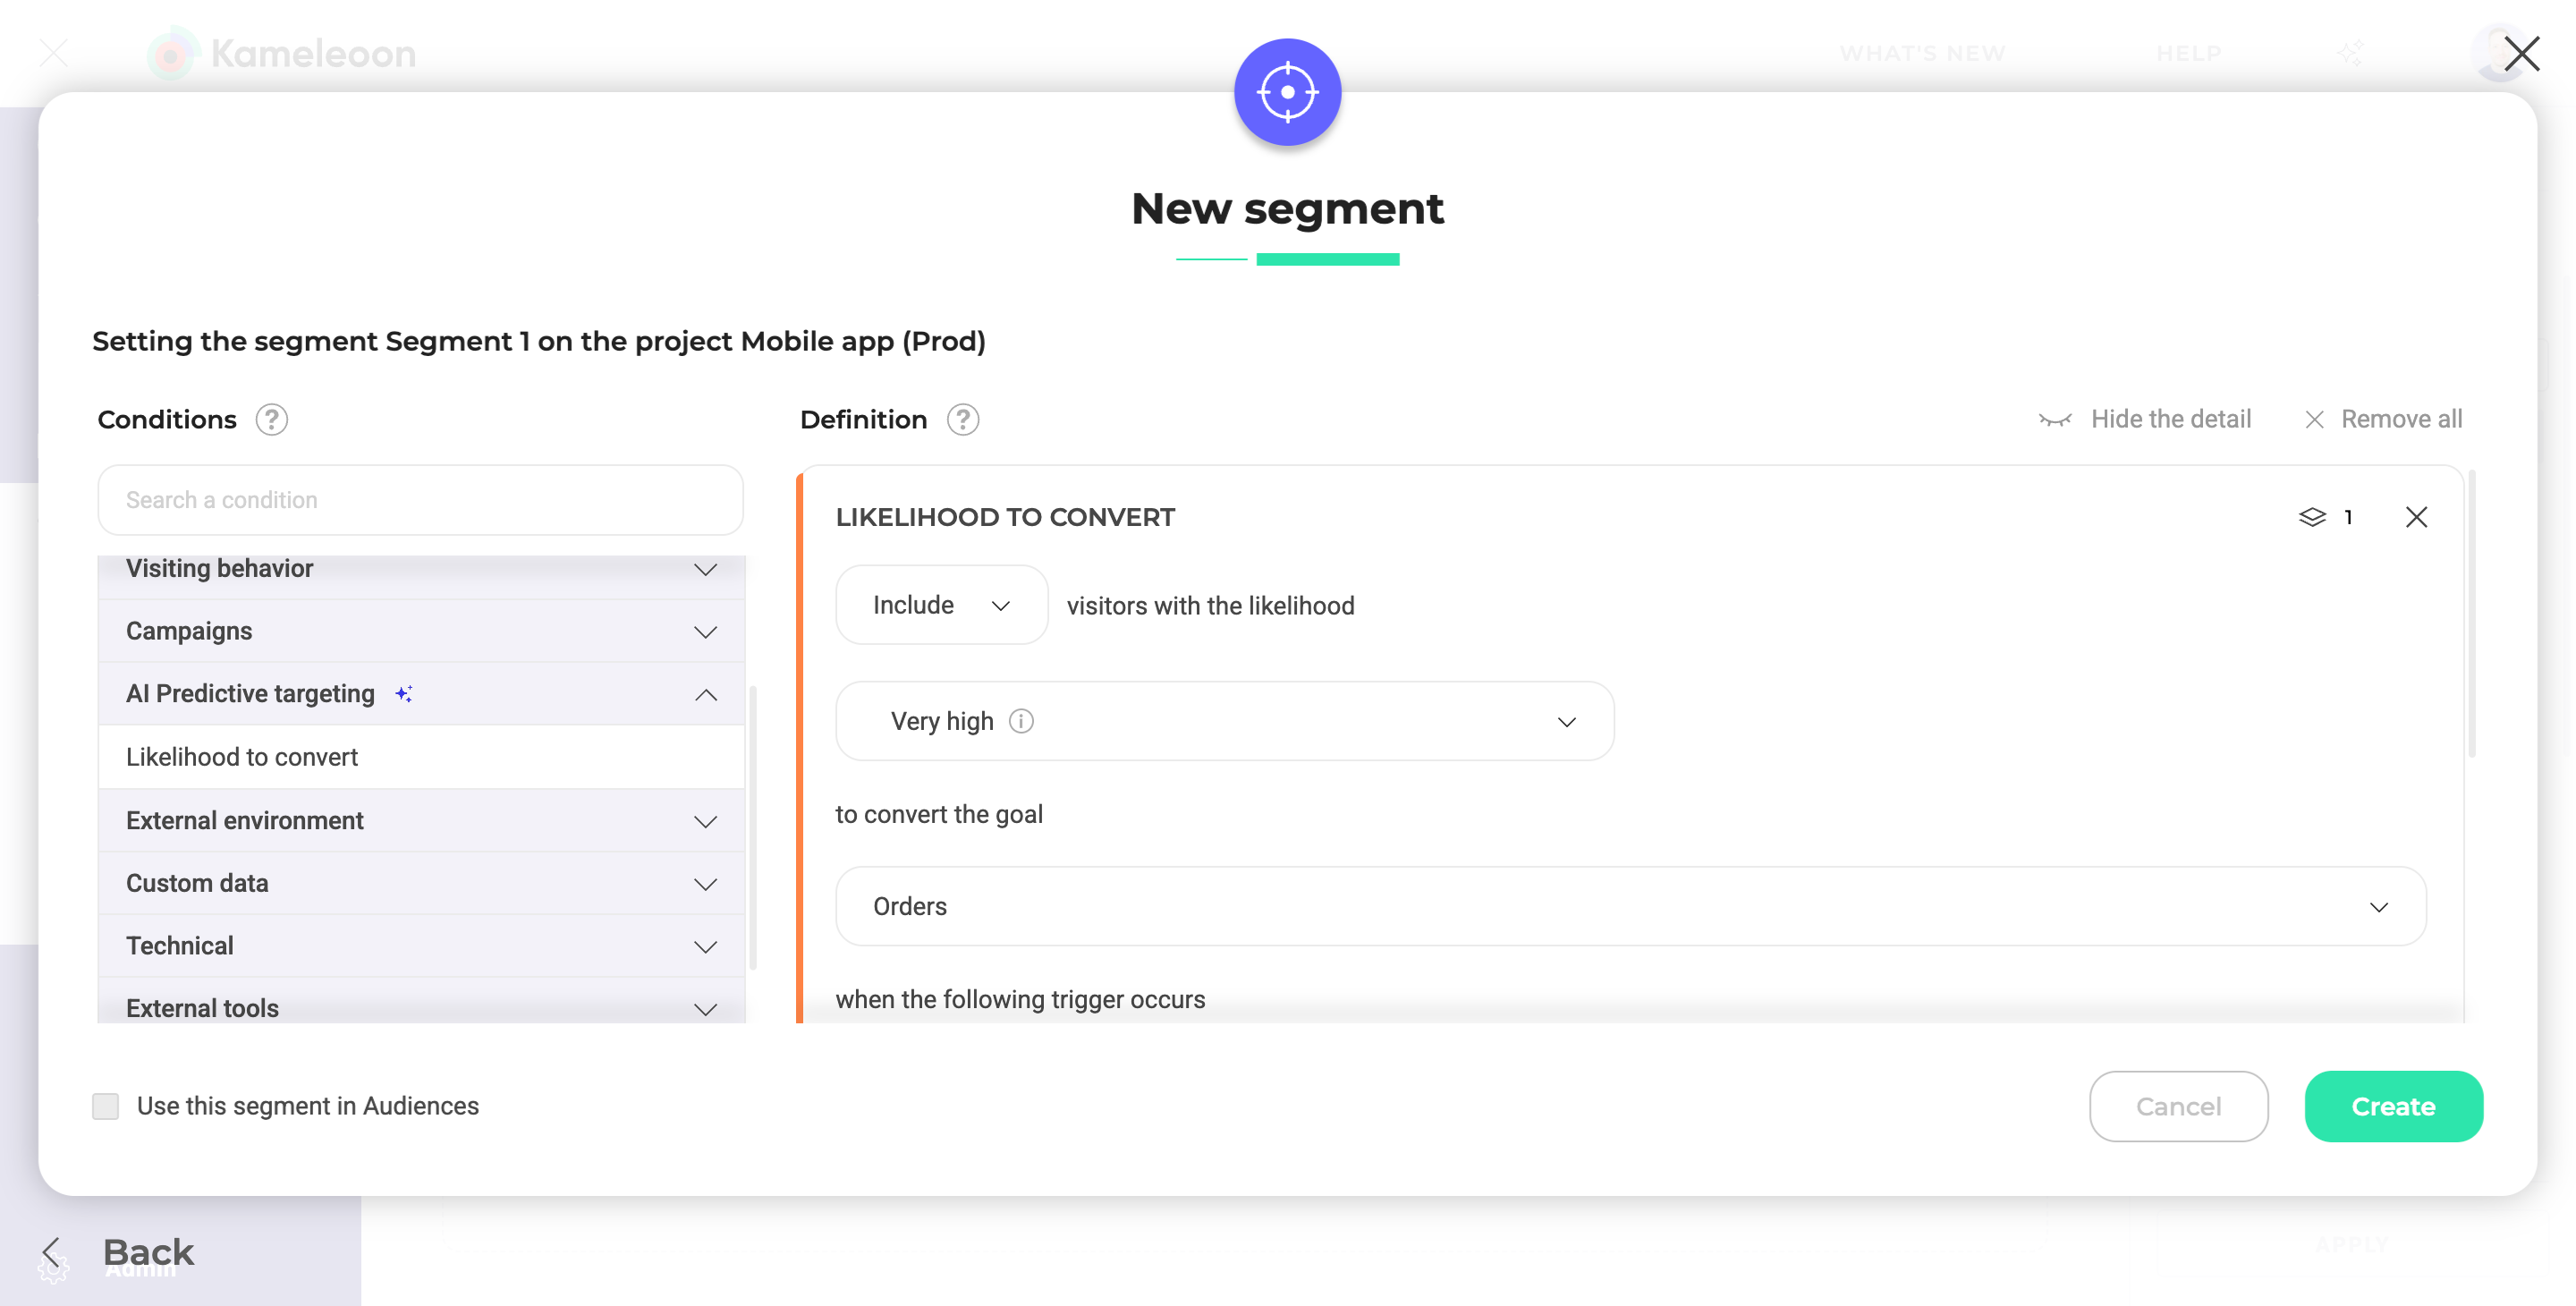
You must have at least one predictive segment or one included segment for any data to appear on this page.
While audience segments are defined and tracked within the Kameleoon UI as described above, for Feature Experimentation (SDK-based experiments), accurately tracking audience assignment requires an explicit action in your code.
Developers must call the evaluateAudiences() method. This method triggers a re-evaluation of the visitor against all defined audience segments based on the visitor data that is known by the SDK at the time evaluateAudiences() is called. evaluateAudiences() should be called after all relevant visitor data has been set or updated, and just before getting a feature variation or checking a feature flag.
Segment chart
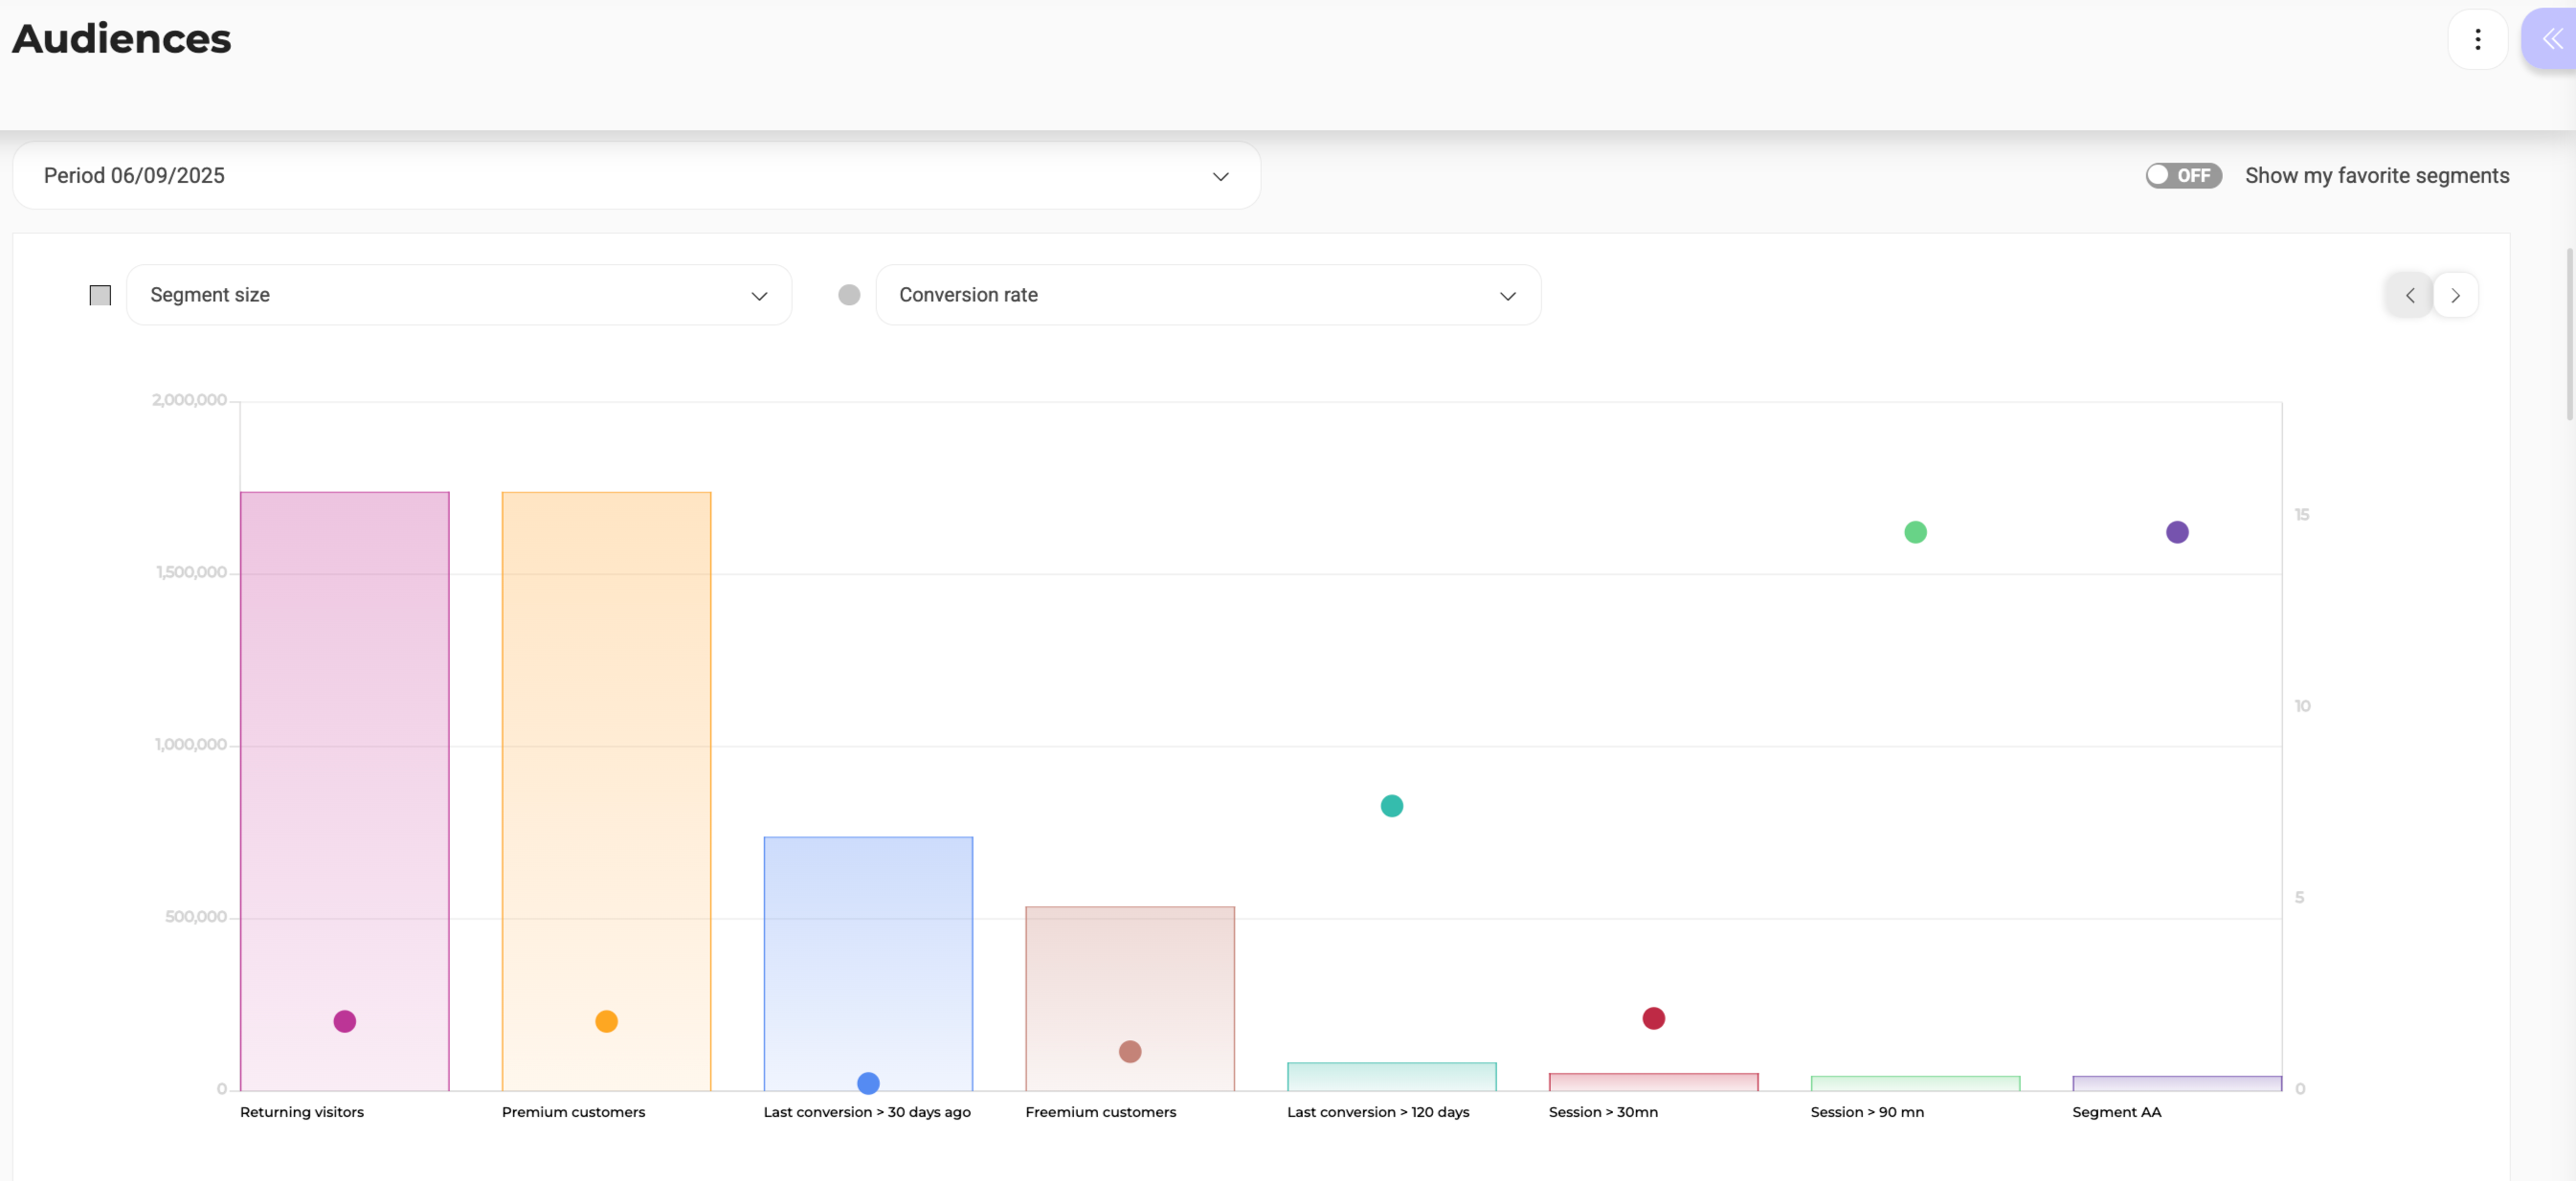
The Analysis of my audience section features a bar chart that provides a visual overview of your selected audience segments.
Chart axes and indicators
- X-axis: Segment names
- Y-axis (left): Segment size (number of visits)
- Y-axis (right): Conversion rate
Chart interaction
- Hover over the bars to view the exact number of visits for a segment.
- Hover over the circles to see the exact conversion rate.
Favorite segments
Toggle the ON/OFF switch to show only your favorite segments. Favorites appear with a colored bar for size and a circle for conversion rate.
Chart parameters
Use the dropdown menus above the chart to change what the axes represent:
- Main axis (bars):
- Segment size (default)
- Average cart
- Overall revenue
- Secondary axis (circles):
- Conversion rate (default)
- Average cart
- Overall revenue
- None (to disable the secondary axis)
Use the Period dropdown above the chart to modify the date range.
Segmentation table
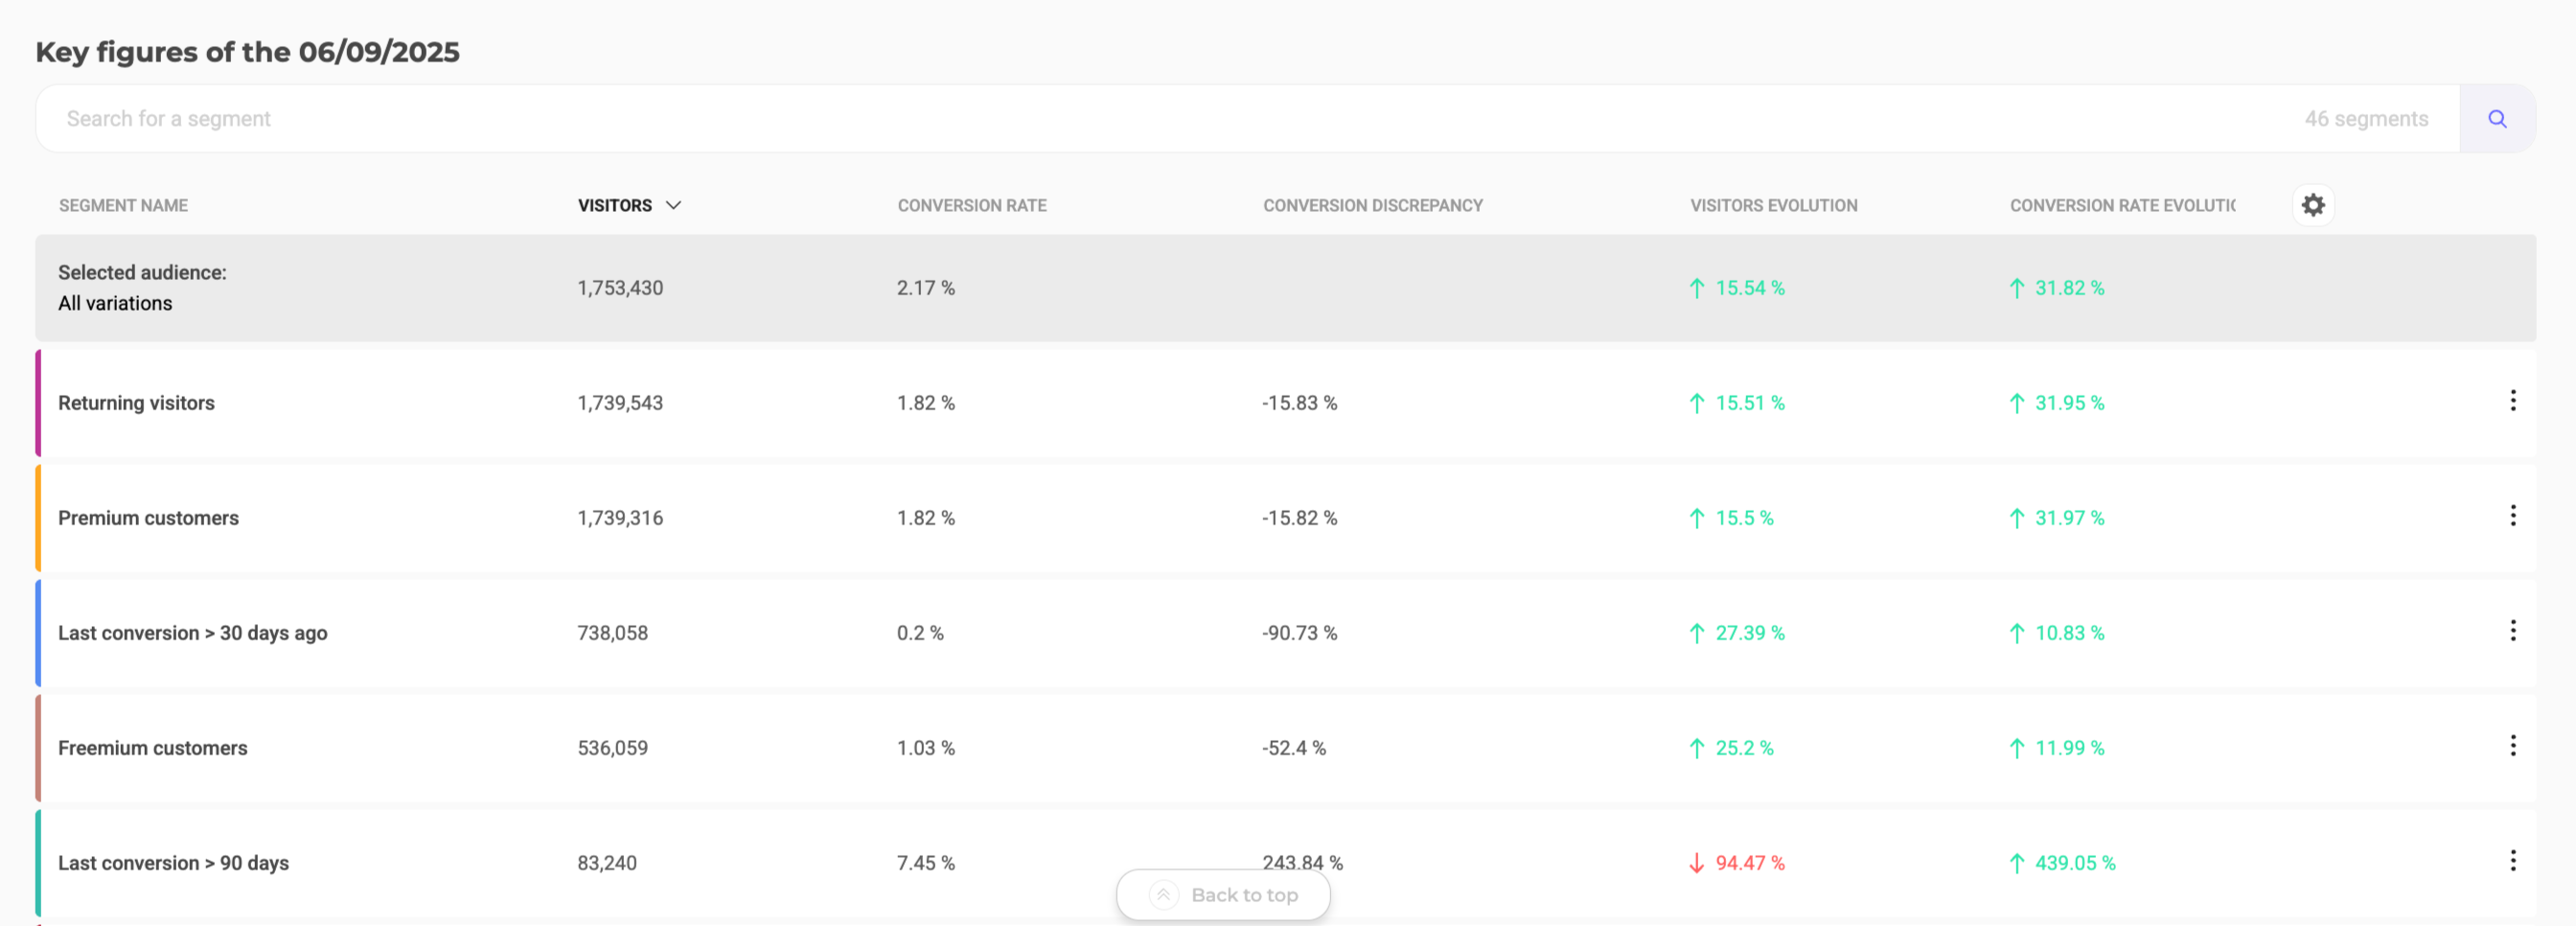
Below the chart, a table called Key figures displays detailed metrics for each segment. Each bar in the chart corresponds to a row in the table.
Default view
Displays the eight most impactful segments based on your selected audience and time period. Use the search bar to locate a specific segment quickly.
Table columns
You can customize which data columns appear using the cog icon:
| Column | Description |
|---|---|
| Visits | Number of visits for the segment and % of total audience. |
| Visits evolution | How visits have changed over time. |
| Conversion rate | % of visits that converted. |
| Conversion rate evolution | How conversion rate has changed over time. |
| Average cart | Average cart value for the segment. |
| Average cart evolution | Cart value trends over time. |
| Overall revenue | Revenue generated by the segment. |
| Overall revenue evolution | Revenue trends over time. |
| Conversion discrepancy | Difference from the overall conversion rate. |
Customize the table
Click the cog icon to open column settings. Drag and drop to rearrange columns and add/remove data points. Click the arrows next to a column order to sort in ascending or descending order.
Filtering
A filtering side panel allows you to refine the audience data displayed in both the chart and the table.
Available filters
You can limit your analysis to visits that:
- Converted on a specific goal
- Were exposed to web experiment
- Were exposed to a personalization campaign
- Belong to a specific segment
- Fulfill a targeting condition
After selecting a filter type, choose specific items like goals, experiments, personalizations, segments, or targeting conditions. Click Reset to clear all applied filters.
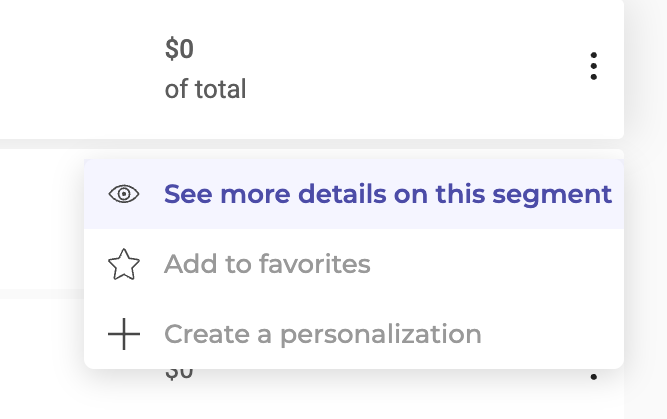
Actions
Click the three-dots menu associated with a segment to access secondary actions:
- See more details on this segment
- Add to favorites
- Create a personalization
Segment identity card
Click the three-dots menu associated with any segment in the Key figures table and click See more details on this segment to access the segment’s identity card.
The Segment identity card page lets you view and consult in detail the segments displayed on the Audiences page.
You can use this page to:
- Fully monitor a segment’s performance over time.
- Learn more about a segment’s behavior.
- Find potential sub-segments that could be useful for your business.
Header
The header of the Segment identity card page provides key actions and period selection:
- Segment name and favorite: If the segment has not been added to your favorites, the star icon next to the segment’s name is empty; if it has, the star is full. To add or remove a segment from your favorites list, click the star.
- Date range: By default, the audience analysis displayed on the page corresponds to the previous day’s traffic. Click the dropdown menu to display the results for the last week, two weeks, month, or six months. You can also apply a custom date range. This selection affects all data presented on the page.
- Create a personalization: Click Create a personalization to open the personalization creation page. An Audiences tag is automatically associated with the personalization, and the segment from which you have just configured the personalization is filled in by default as the exposed segment.
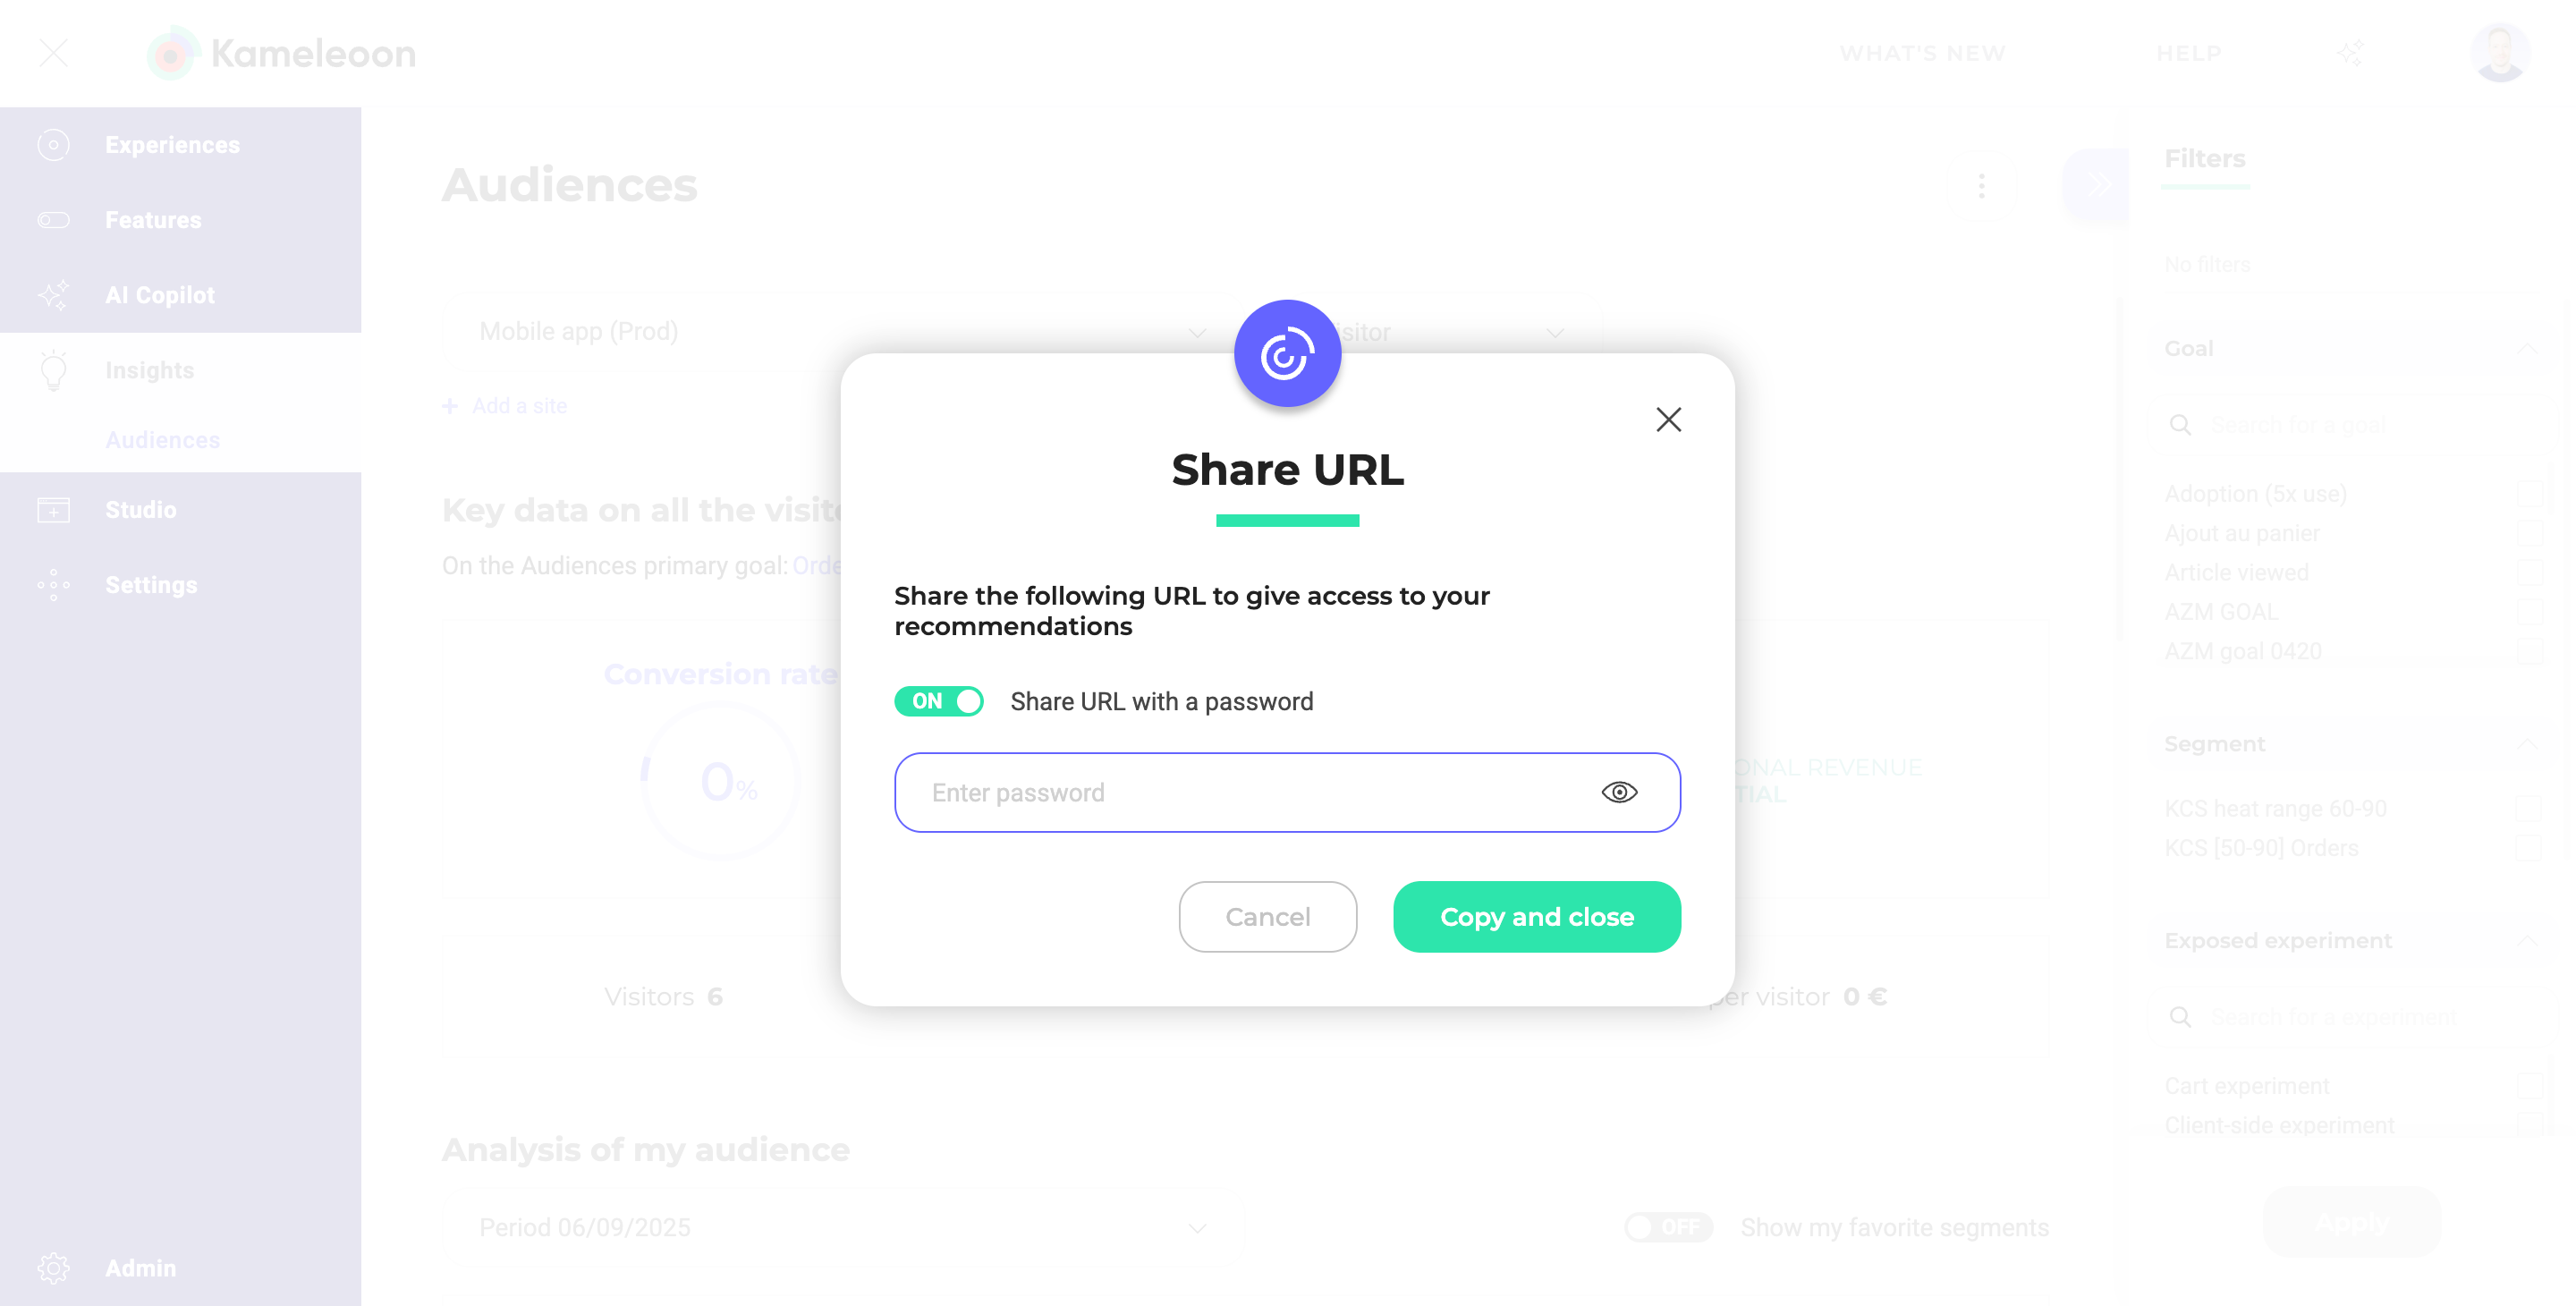
- Actions menu: Click the three-dots menu to access actions such as Export to PDF, Share URL, and Print—the same options the Audiences page provides.
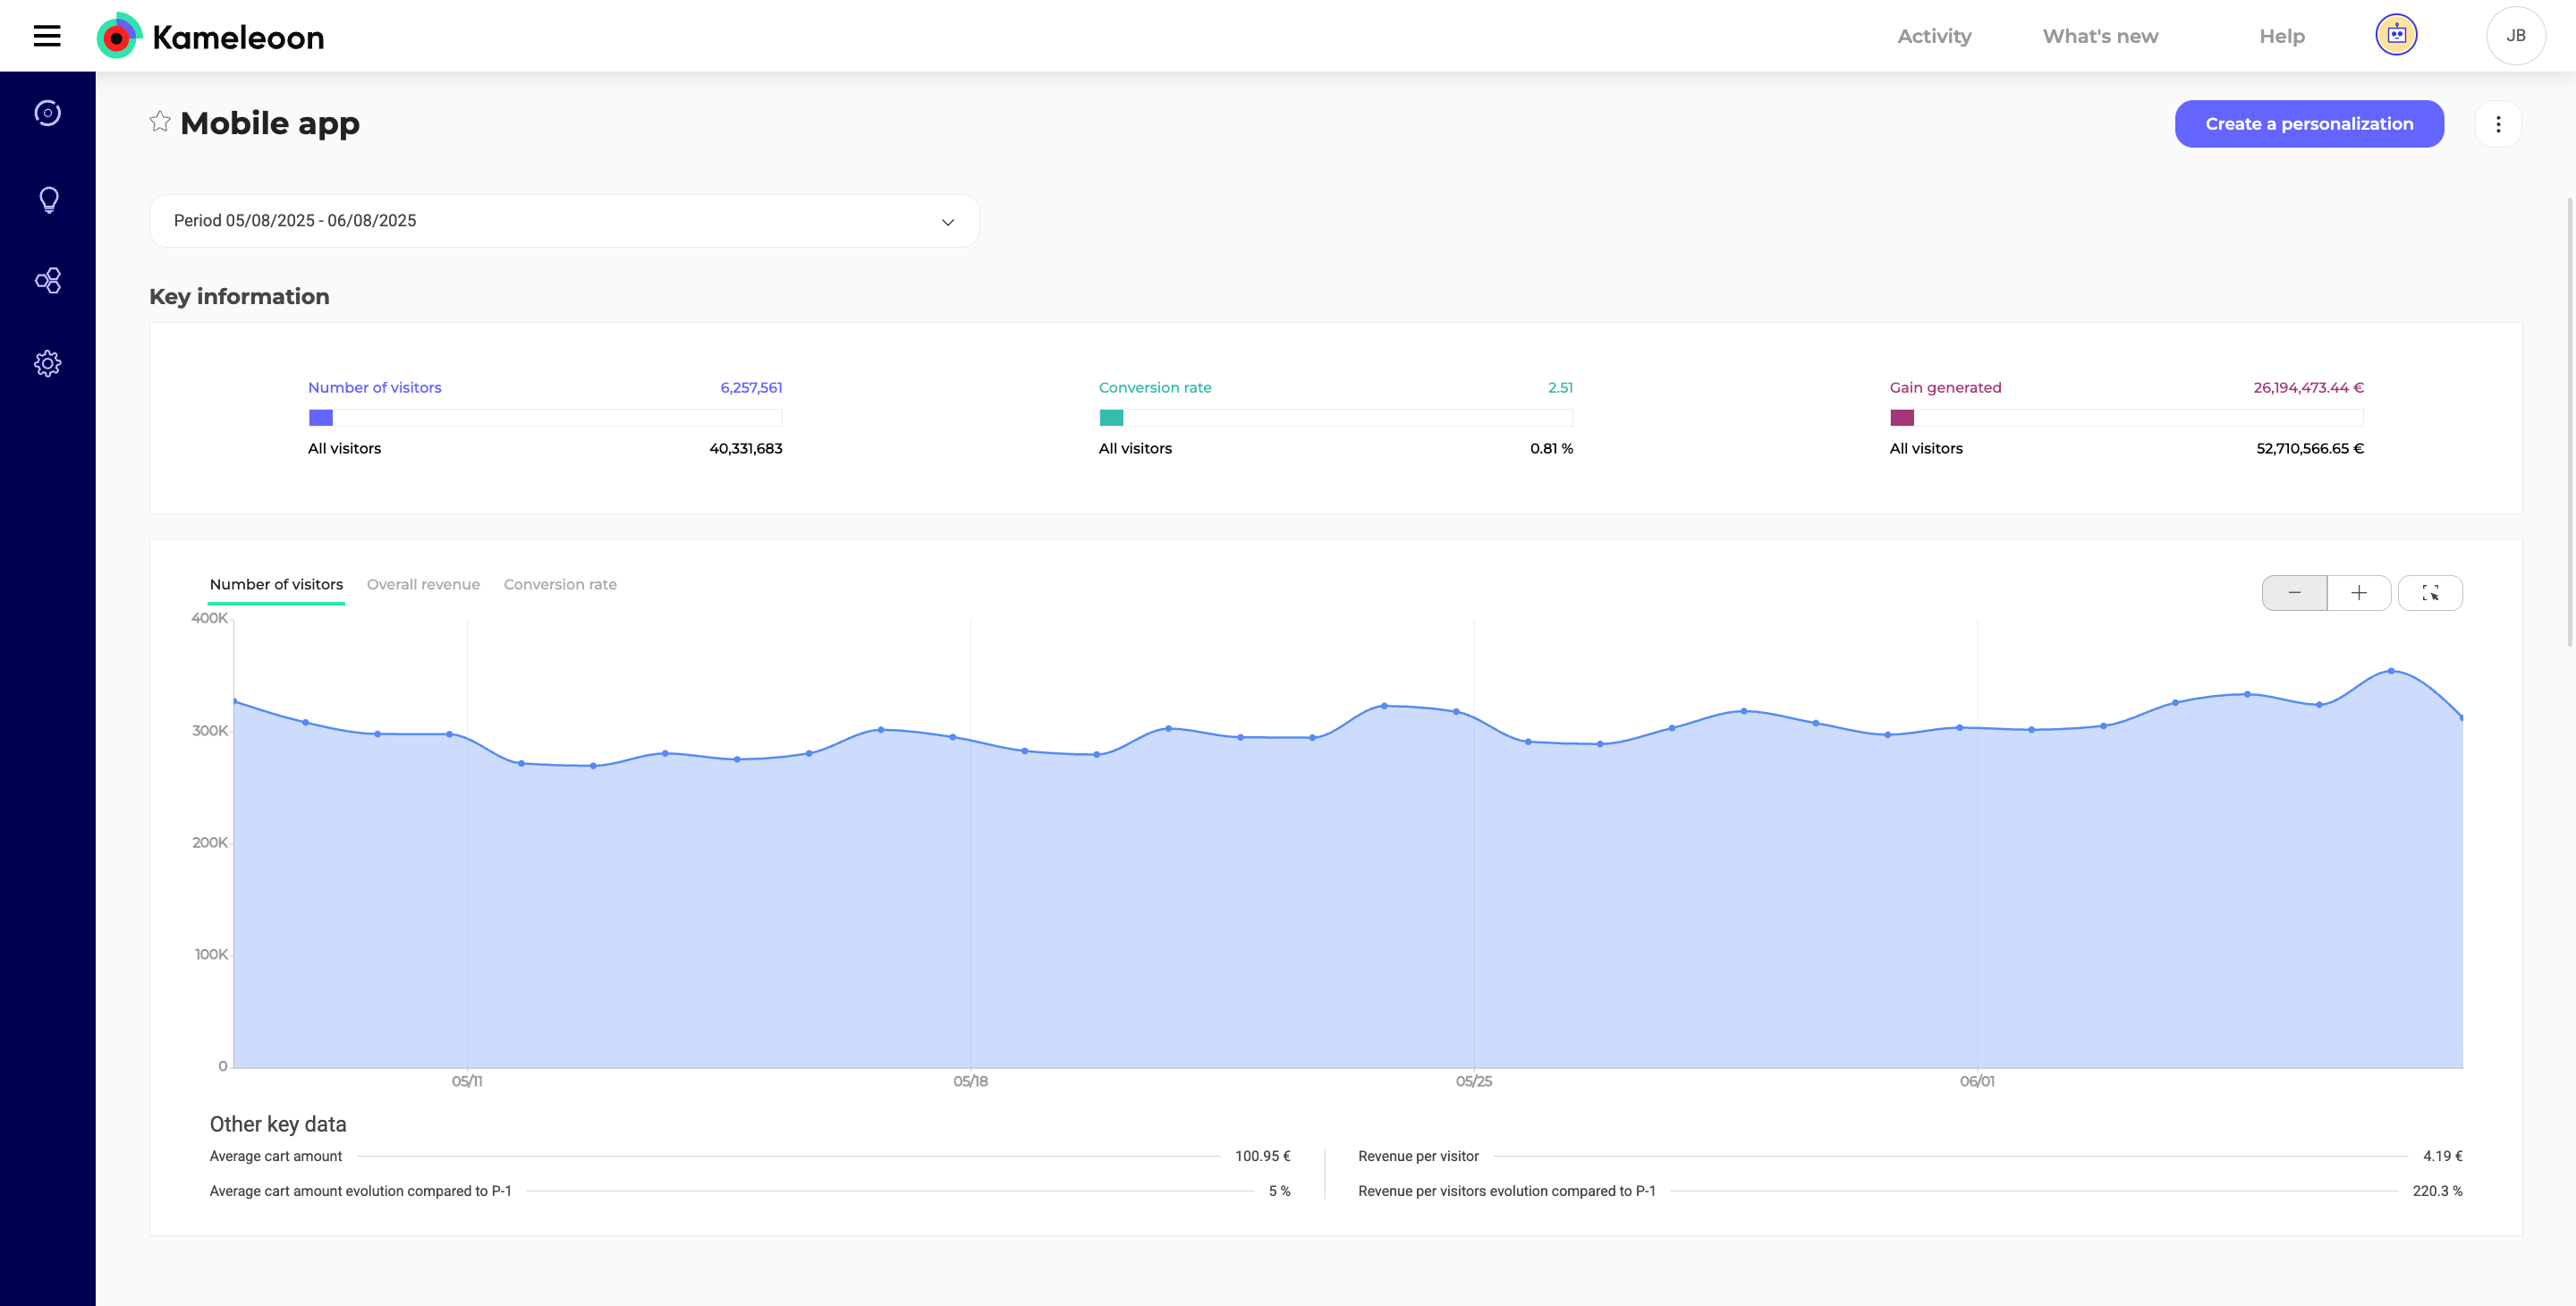
Key information
Several pieces of information about the segment are gathered here, presented in the form of three gauges:
- Number of visits: Mouse-over to display the total number of visits made by visitors included in the segment, and the ratio they represent in relation to the total audience. Visually, the data is also represented by the ratio between the blue zone (number of visits included in the segment) and the gauge (total number of visits).
- Conversion rate: The conversion rate is shown in the same way as the segment size (maximum is 100%). Below the gauge is the conversion rate for all visits, for comparison.
- Gain generated: This gauge represents the revenue generated by the visitors included in the segment compared to the revenue generated by all visitors. On mouse-over, the percentage represented by the segment appears.
Key information graphs
Three graphs show the evolution of key information over time:
- Evolution of the segment size (Number of visits).
- Evolution of the generated revenue (Overall revenue).
- Evolution of the conversion rate (Conversion rate).
For more clarity, the colors used in these graphs are the same as those in the Key information section. Navigate between the tabs to consult the three curves. When you hover over a curve, data is displayed. Zoom, zoom out, and free zoom tools allow you to focus on certain parts of the graph.
Other key data
Below the graphs, you will find other important data:
- The average cart amount.
- The average cart amount evolution compared to the previous period.
- The revenue per visit.
- The evolution of the revenue per visit compared to the previous period.
The data displayed depends on the period you have selected in the header. Evolution can be positive, negative, or neutral.
Segment details
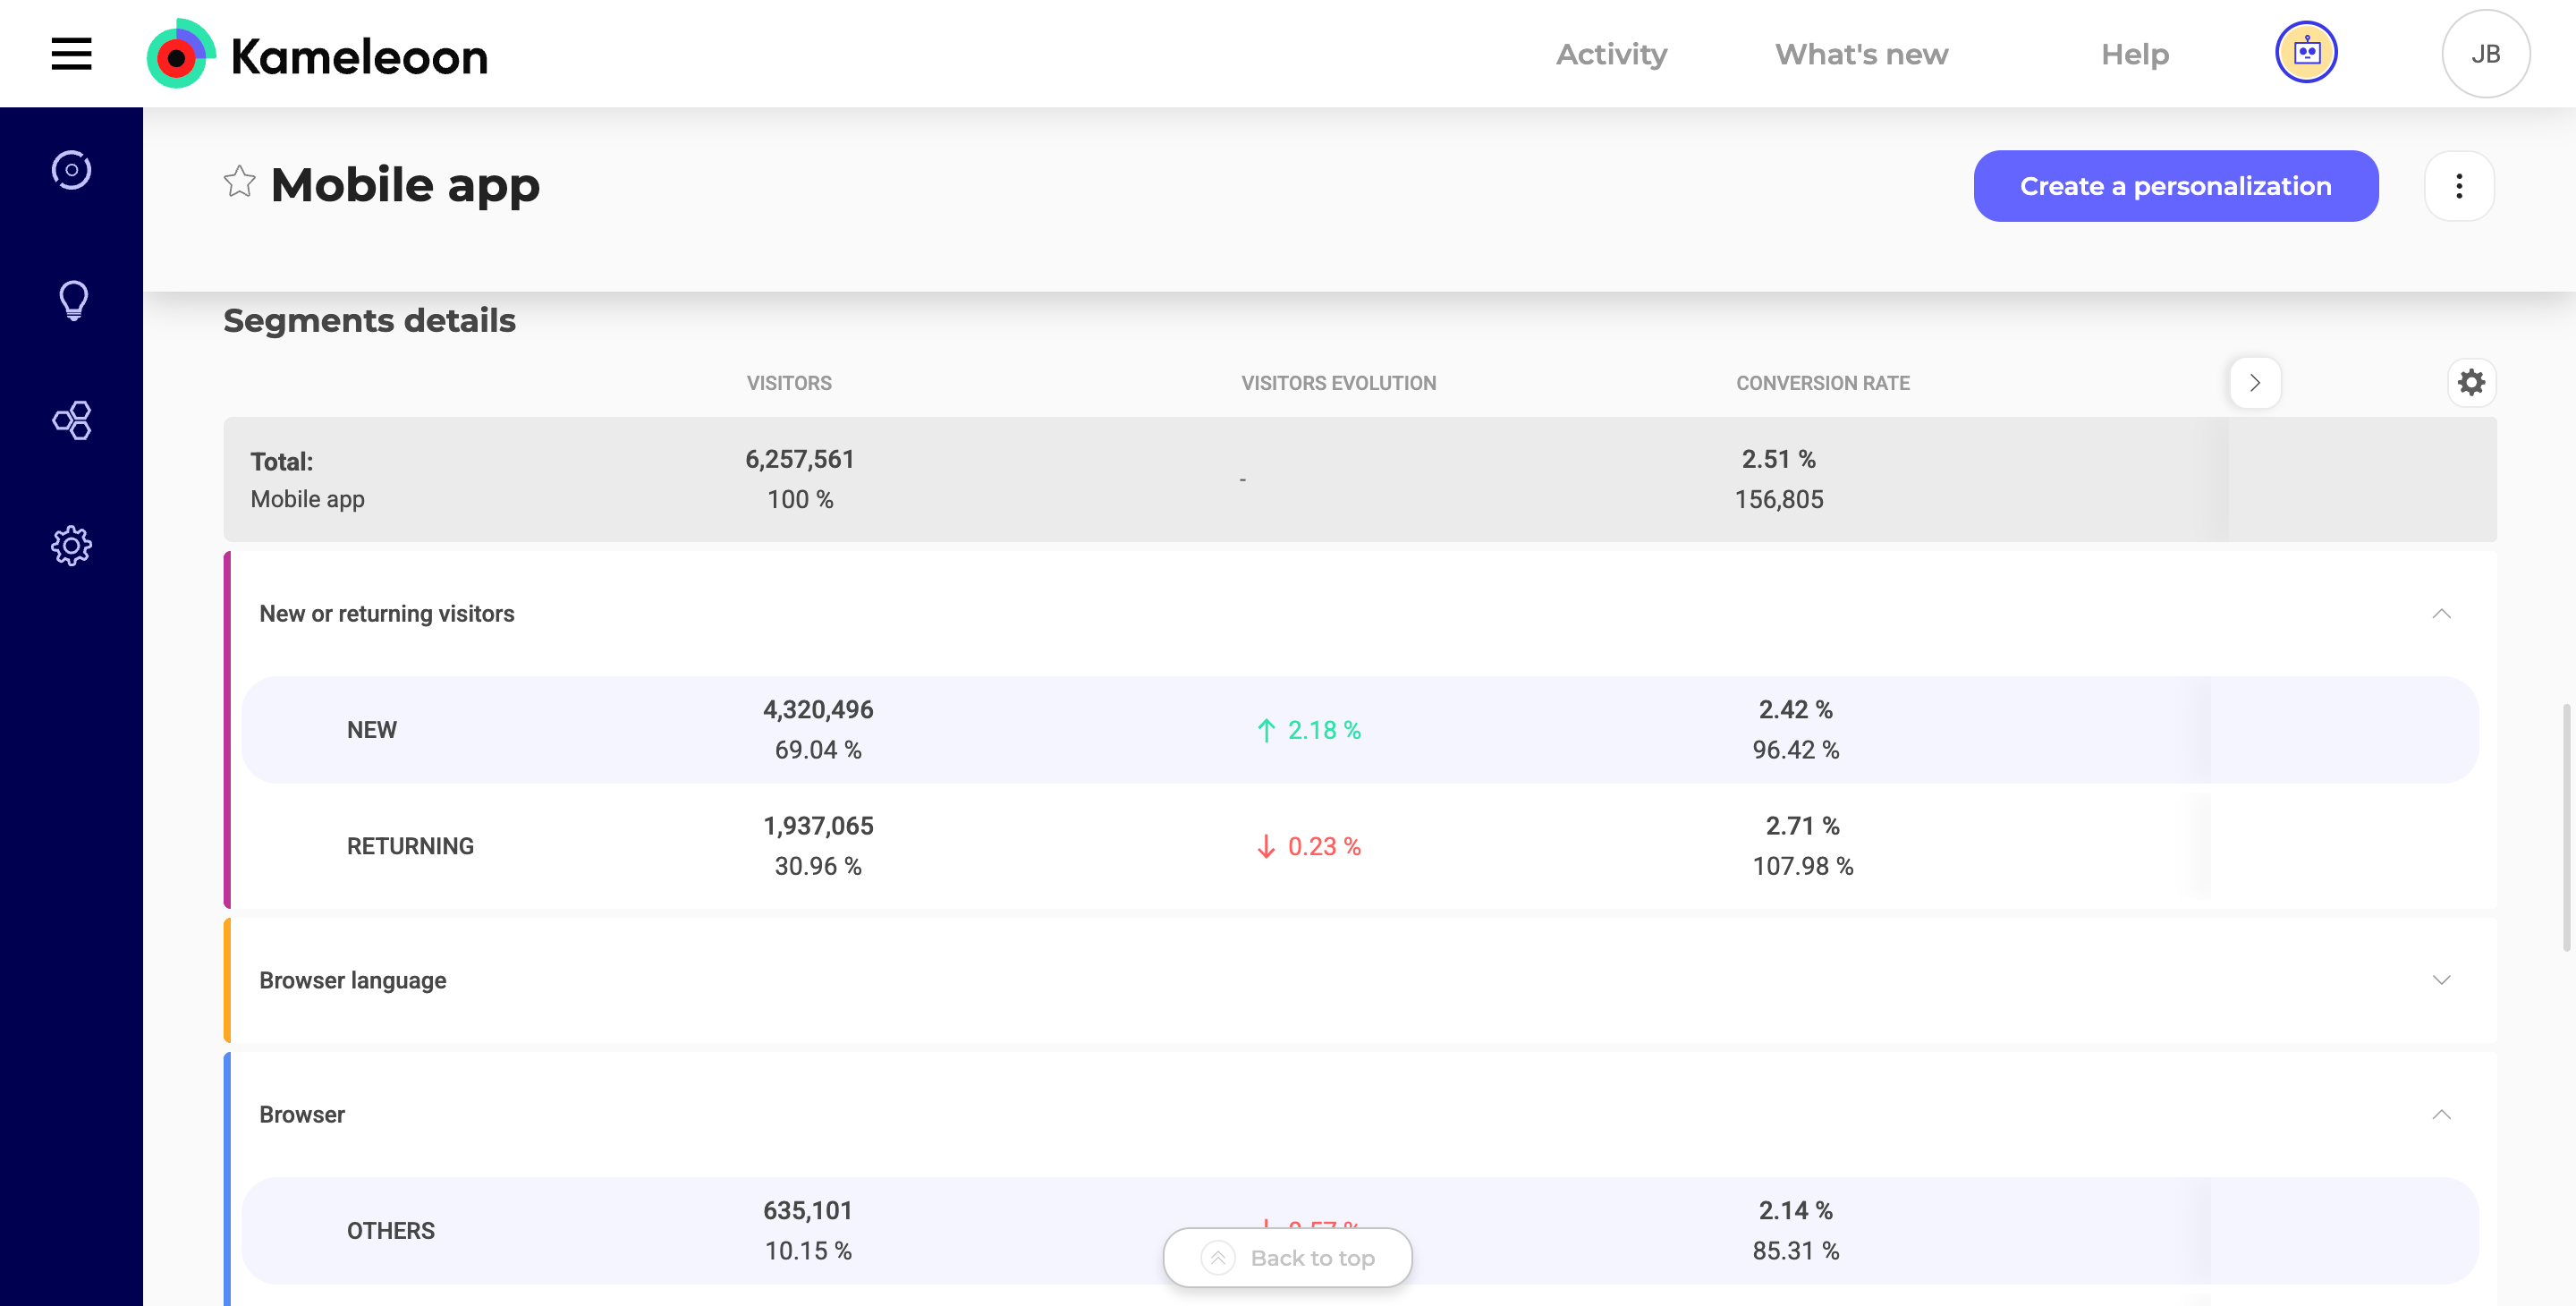
This section shows some key segment data, broken down by targeting condition. You can also uncover sub-segments, which may have an atypical behavior in terms of conversion (which overperform or underperform). For example, a segment that has a low conversion rate but clearly outperforms on mobile visits.
- Columns: Click to display the cog icon to display the settings menu. You can select which columns to display and change their associated data:
- Visits: The number of visits involved and their ratio to the total number of visits in the segment.
- Visits evolution: The percentage change in the number of visits between P (current period) and P-1 (previous period).
- Conversion rate: The conversion rate associated with the segment in question, and the number of visits converted in this segment.
- Conversion rate evolution: The percentage of change in conversion rate between P and P-1.
- Conversion discrepancy: The difference between the conversion on this segment and the overall conversion.
- Overall revenue: The revenue and the percentage of revenue associated with the targeted population compared to the total revenue of the segment.
- Criteria: Click Criteria > +Add criteria to create new criteria for the table.
- Only visitors who fulfill the selected criteria will be counted in the table’s data.