Audiences — Key metrics
Kameleoon's Audiences feature helps you understand and analyze the performance of your experiment program through key metrics and your main segments. With Audiences, you have access to essential metrics and advanced segmentation tools to refine your insights. This powerful tool allows you to make data-driven decisions and improve the performance of your campaigns.
This article explores the key metrics available through the Audiences page and how to interpret and leverage them effectively.
Overview of the Audiences page
Before accessing metrics, you must configure Audiences. Refer to this article to get started.
To access the Audiences page, click Insight > Audiences. This page helps you:
- View your experiment program's performance over the past 12 months.
- Analyze and compare the behavior of audience segments.
- Track high-level metrics, such as revenue, visits, and conversion data.
The data on this page is computed daily—so you’re always accessing the most up-to-date information about your audience.
The Audiences page is divided into the following sections:
- Header
- Key data
- Audience segmentation graph
- Audience segmentation table
If you have installed Kameleoon on multiple projects, you can navigate between them using the dropdown menu in the top-right corner of the page.
You can also switch between Visit or Visitor views to change the scope of analysis. The default scope is Visitor.
Key metrics
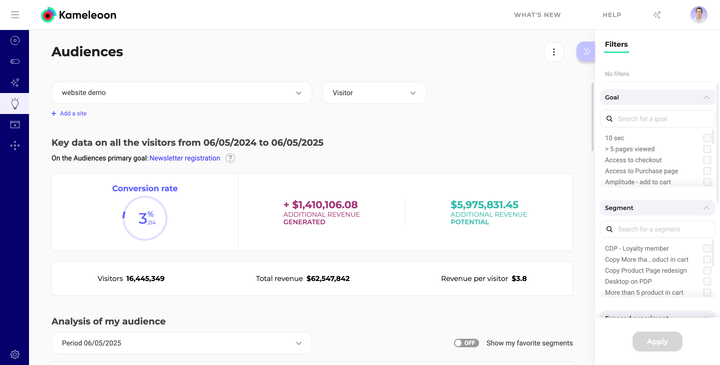
The Key data block provides a high-level summary of your website's performance, based on your primary goal. These metrics are calculated using all campaigns that were active during the selected period and configured to track your main audience goal. Campaigns must meet a minimum number of visits to be included in these calculations.
Revenue figures are computed under the assumption that there were no interferences between campaigns. The winning variation is whichever generated the most revenue per visit.
Conversion rate
The average conversion rate among the visits included in the audience. It represents the percentage of visits or visitors that result in a conversion based on your configured goal.
Visitors/visits
Total number of visits or unique visitors analyzed depending on the selected scope.
Total revenue
Total revenue generated from all visits during the selected period.
Additional revenue generated
The additional income generated by the winning variations of your experiments compared to their original variations.
Formula:

Additional revenue potential
The total revenue that could have been generated if 100% of each campaign’s traffic had been allocated to its winning variation.
Formula:

Revenue per visitor
The average revenue each visitor (or visit) generates.
Formula: