
A new campaign results page is available! Discover its features
Several options are there to adapt the display of results to your needs. Filter your results, limit them to a particular date range, and choose the type of view of visits and conversions.
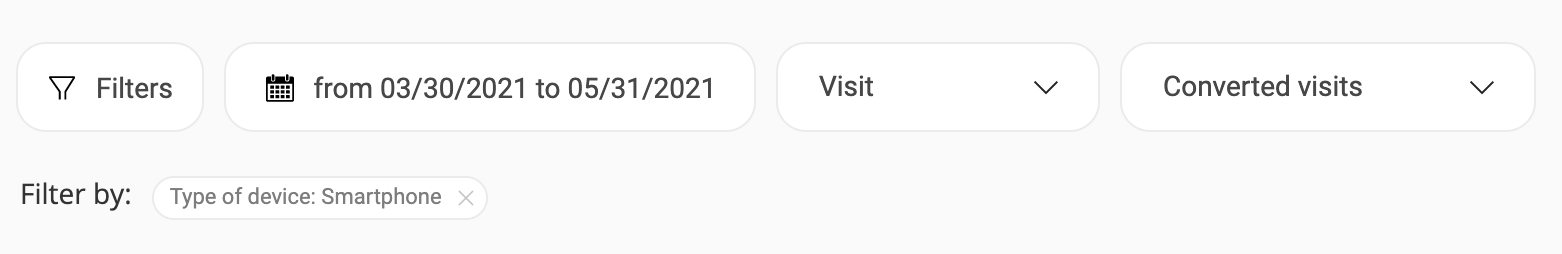
Filters
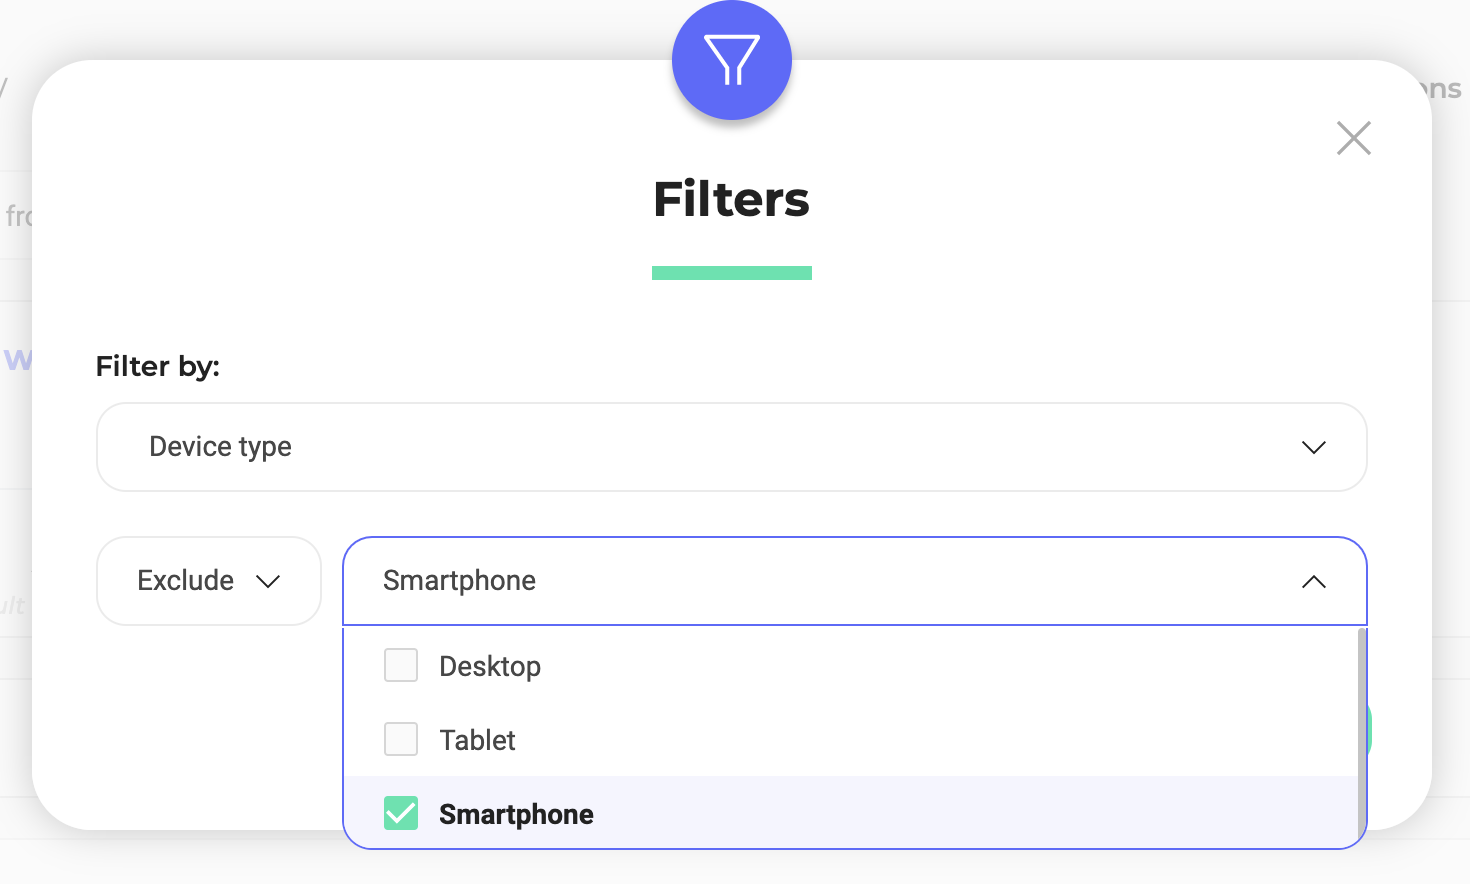
Use filters to limit the display of results to visitors meeting specific criteria.
Among the filtering criteria available, you will find many of the segmentation criteria.
Filter by Campaign
With the Campaign filter you can filter the results according to whether your visitors have been exposed to one of your campaigns (experiment and/or personalization). Once the filter has been applied, the specific variation your visitors have seen becomes visible in the result tables located at the bottom of the page. You can use this filter to analyse the impact of specific campaigns on others.

Filter by SDK
If your campaign targeted visits that have events sent by one of our SDKs, you can apply the SDK filters to see your results only for a given SDK.

Date range
When you apply a date range to the display of your results, the page only takes into account results within that range of dates.
To set a date range, click the calendar at the top of the page.
A pop-up opens and allows you to set the start and end dates of the date range.
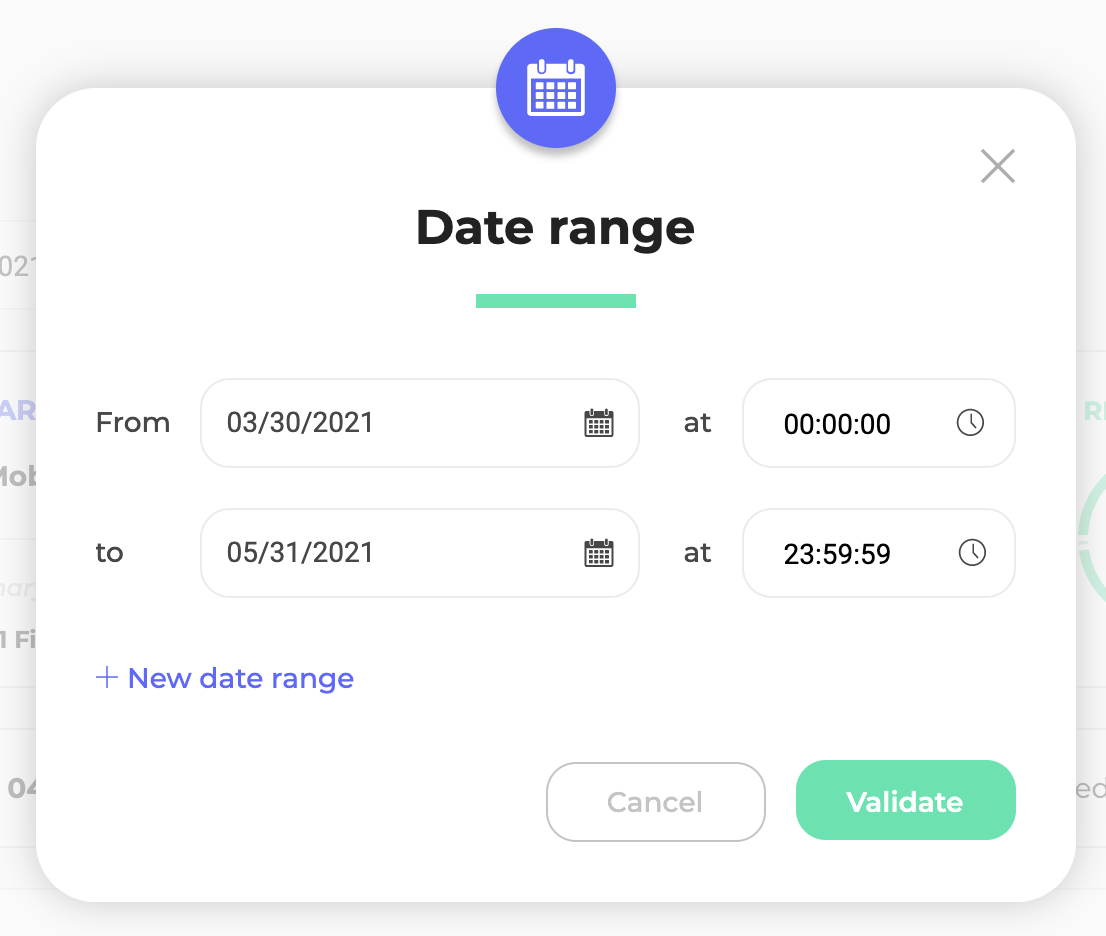
Start by setting a start date to your date range. To do this, click on the first zone and in the calendar that opens, select the date of your choice.
Click the second date box to set an end date to your date range.
To set multiple date ranges, click New date range.

The results page will show the results of all the set date ranges.
Visit / visitor
Two modes are available for viewing data:
- Per visit;
- Per visitor.
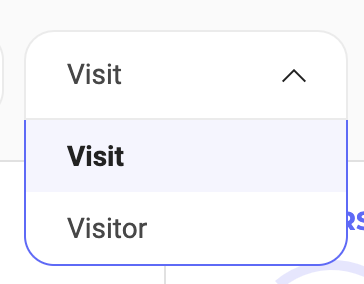
Conventionally, the view per visit will count each visit regardless of the visitor. Viewing by visitor, on the other hand, will count unique visits.
For example, a visitor who visits the site three times will be counted as three visits in View per visit mode and as a single visitor in View per visitor mode.
When you change the display mode, the results of the page are recalculated according to the display mode you have chosen (number of visits or visitors). Improvement and conversion rates, in particular, are highly likely to change.
All conversions / converted visits
A second drop-down menu allows you to choose between a display of total conversions and a display of converted visits.
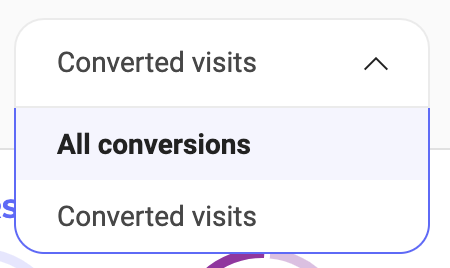
If All conversions is selected, a unique visitor who converted 3 times during the same session will be counted as 3 conversions.
On the other hand, if Converted visits is selected, this same visitor will be counted as a converted visit, regardless of the number of conversions during the session.
Note: When the “All conversions” option is selected, the improvement rate range (represented, in the results tables, by the colored moustache box and the percentages that appear on hover) and the reliability rate are computed using a different statistical model.
This allow you to test the hypothesis that your visitors are converting more often in average when they are exposed to the variation.
