Using the Homepage
The Homepage serves as the centralized command center for your experimentation activity. It allows you to monitor campaign performance, access key data, and coordinate with your team.
Use the Homepage to get a quick snapshot of your current projects, track financial or non-monetary goals, and navigate back to your most recent work.
Global settings
Before analyzing your data, ensure you are viewing the correct timeframe and project scope.
Select a timeframe
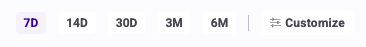
At the top of the page, use the time selector to define the period for your displayed data. You can choose from the following options:
- 7 days
- 14 days
- 30 days
- 3 months
- 6 months
Customize your dashboard
Click Customize in the top right corner to configure your Homepage view. A pop-up window allows you to adjust the following settings:
- Data settings:
- Site: Select the specific site or project you want to view data for.
- Goal: Choose the primary goal used to calculate the Key Performance Indicators (KPIs) in the Highlights section. The KPIs displayed will vary depending on whether the selected goal is monetary (for example, revenue) or non-monetary (for example, conversions or retention).
- Display blocks:
- Toggle the eye icon next to any section name to hide or show that block on your homepage.
- Click Apply to save your changes.
Dashboard sections
The Homepage is divided into several sections (blocks) that provide specific insights and shortcuts.
Recently opened
Quickly resume your work without searching through the platform. This section lists the pages you visited most recently, including:
- Experiments
- Personalizations
- Feature flags
- Widgets
Highlights
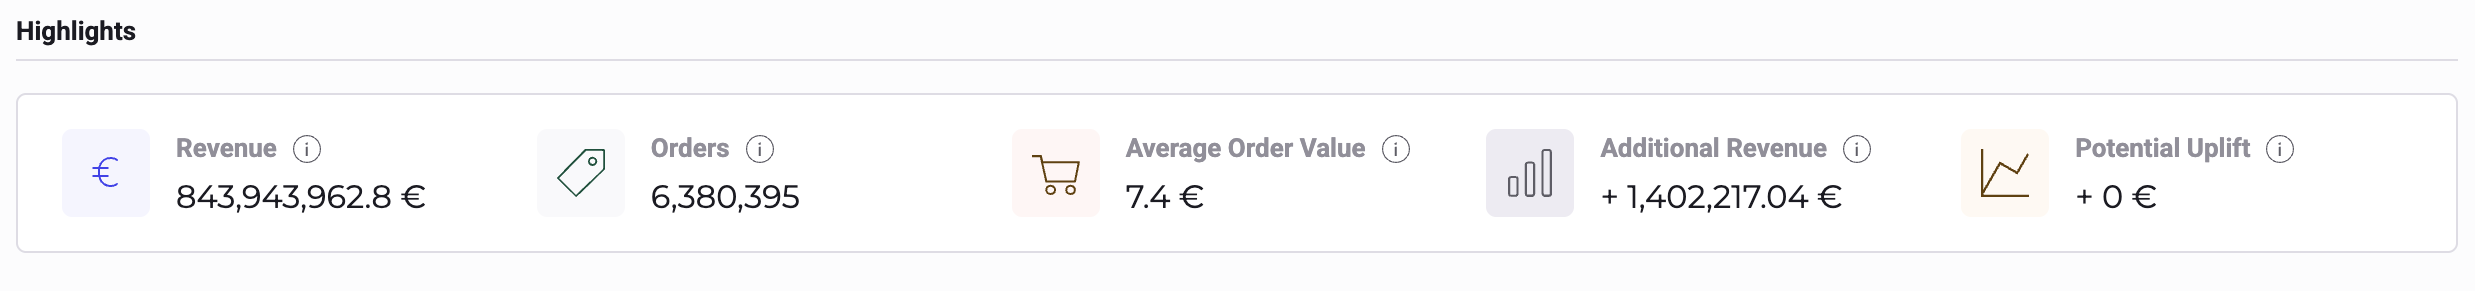
The Highlights section displays the main KPIs for your selected project. Depending on the goal you chose in the Customize menu, this provides a snapshot of your financial or non-monetary performance (such as revenue or conversion uplift).
The metrics displayed on the Homepage are not real-time. Data is updated daily and reflects activity up to the previous day.
Launched campaigns
Track your historical activity with the Launched campaigns section. This area shows a timeline of the campaigns you have rolled out, helping you visualize the volume of experiments or flags deployed over time.
Currently live
View a list of all campaigns that are currently active and impacting users. This section helps you understand exactly what is running on your site right now.
The table displays:
- Name: The name of the campaign.
- Type: Whether it is an A/B test, personalization, or feature flag.
- Live since: The duration the campaign has been active.
Targeted unique visitors
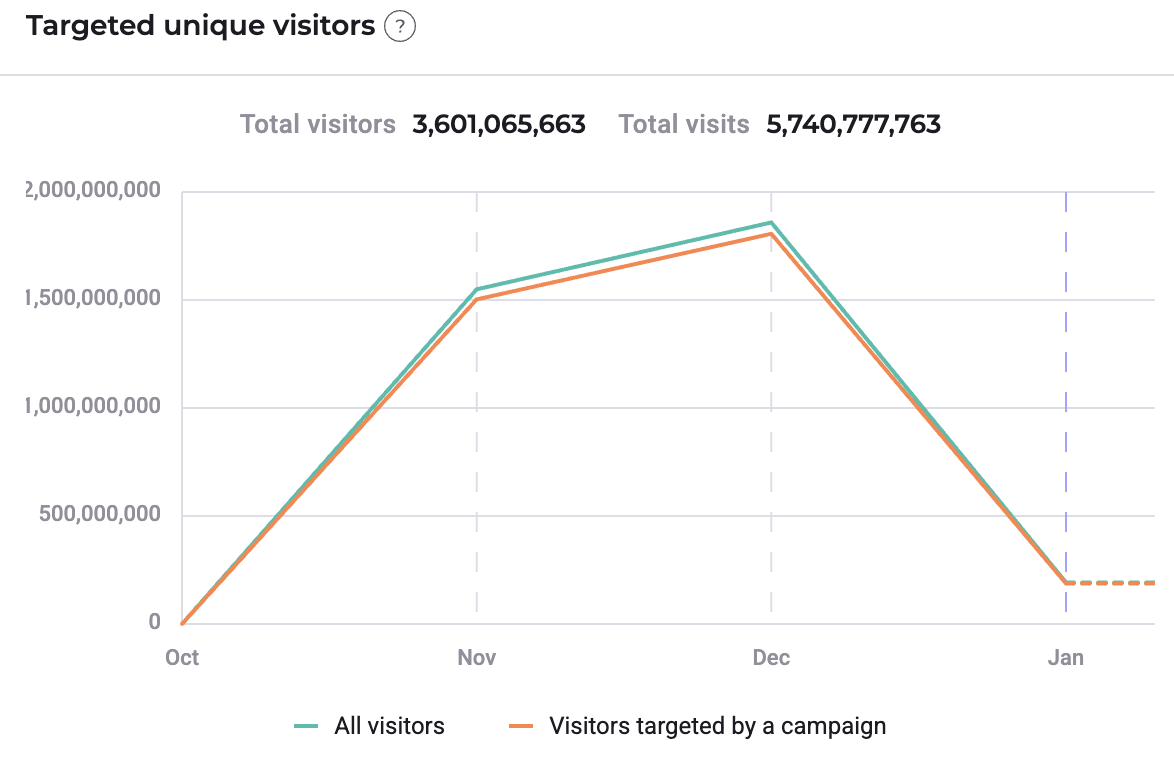
This chart visualizes the traffic your campaigns receive. It tracks the number of individual users exposed to a campaign or experiment over the selected timeframe.
A "unique visitor" is counted only once per session, even if they are exposed to the campaign multiple times.
Scheduled campaigns
Anticipate upcoming work by viewing campaigns planned for a future launch. This section lists experiments and flags that are scheduled but not yet active.
Team notes
Use the Team notes section to coordinate with your team, leave reminders, or provide context on ongoing work.
- This is a shared free-text area.
- Everyone with access to the project can view and edit these notes.
- Changes are saved automatically and shared across the team.
Useful links
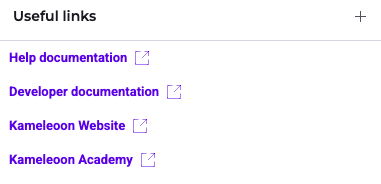
Access helpful resources quickly. This section contains shortcuts to official documentation and allows you to add custom links to frequently used pages or external resources.
Click the + icon to add a new link. To edit a link, click the pencil icon. To delete a link, click the X icon.
