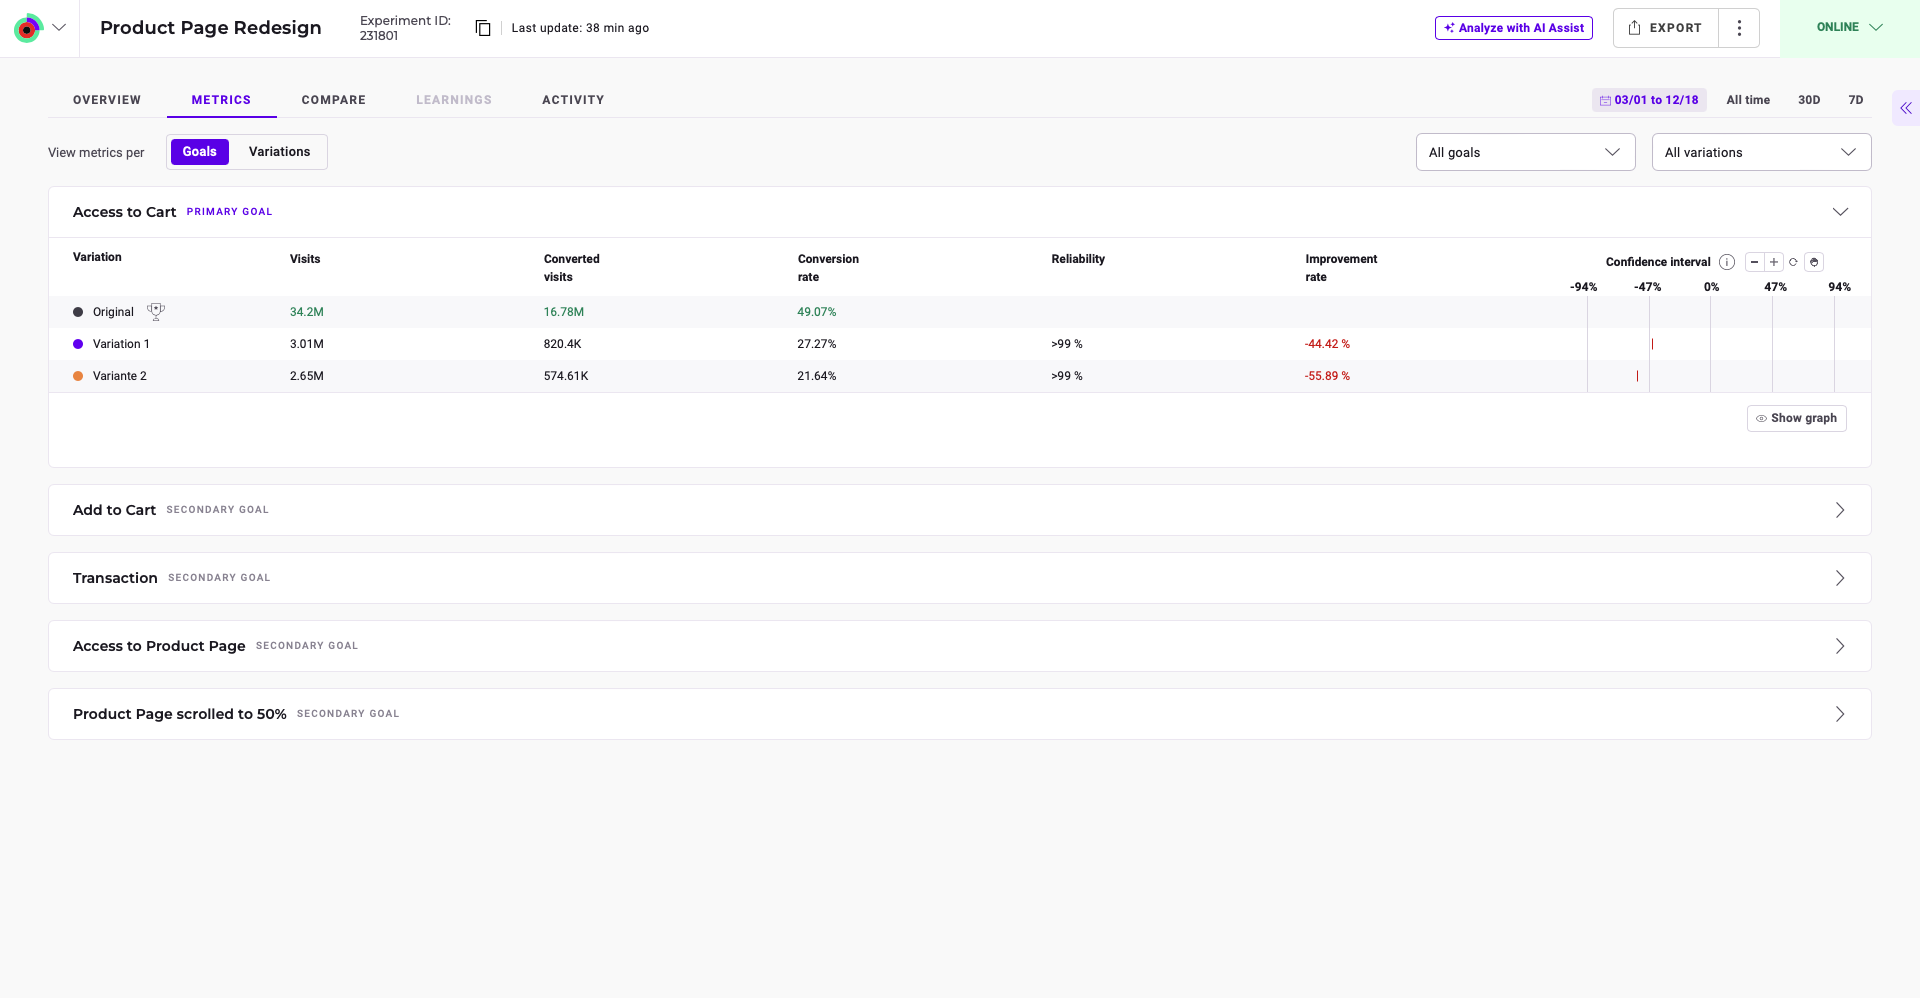
The Metrics menu lets you assess variations’ performance in your experiment. Here, you can view critical metrics for each variation, either per goal or variation, to understand how each variation performs relative to your objectives.
Viewing metrics per goal or variation
A critical component of the Results page is the ability to track and analyze metrics per goal and variation. This flexibility enables you to understand how each variation performs against your experiment’s predefined goals. By providing visibility to these metrics, you can confidently identify which variations are most effective and ensure that you base your decisions on reliable, goal-specific data.
You can view metrics by goal or variation, depending on your needs.
- To view metrics by goal, click Goals.
- To switch to viewing metrics by variation, click Variation.
You can customize which goals or variations are displayed by following these steps:
- Click the goals or variations dropdown.
- Check or uncheck the items (goals or variations) you want to display or hide.
Goals
The Goals section displays both the primary and secondary goals for your experiment. To view detailed performance data for a specific goal, click anywhere on the goal’s panel. A breakdown of key metrics will appear, including:
- Variation names
- Visits
- Converted visits
- Conversion rate
- Reliability score
For relevant goals, revenue metrics will also be displayed. The metrics here include:
- Average cart value
- Revenue per visit
- Total revenue
On a campaign results page, a session is counted as a converted visit only if the conversion occurs after the campaign’s targeting. This helps eliminate noise and provides a more accurate estimate of the variation’s impact.
You can also visualize the data by clicking Show graph. Once the graph is displayed:
- Use the first dropdown to select the metric you want to visualize.
- Use the second dropdown to choose which variations you want to include in the graph (you can check or uncheck variations).
- Use the third dropdown to select the time range for the data you want to analyze.
To hide the graph, click Hide graph.
Variations

The Variations section provides an overview of how each variation in your experiment is performing on your goals. Each variation’s panel includes the following metrics:
- Traffic diversion
- Number of visits
- Converted visits
- Reliability score
- Improvement rate
- Confidence interval
Confidence interval
The confidence interval graph provides several manipulation tools:
- Zoom in: Click +.
- Zoom out: Click –.
- Reset: Click the reset icon.
- Drag view: Select the hand icon, then click and drag the graph. Click the hand icon again to re-enable hover functionality.
Revenue metrics
A separate section, Revenue metrics attached to Variation X, is available. This section lists:
- Average cart value
- Revenue per visit
- Total revenue
- Reliability score
- Improvement rate
- Confidence interval
Revenue chart
You can also visualize revenue data by clicking Show graph. Once the graph is displayed:
- Use the first dropdown to select the metric you want to visualize (conversion rate, number of visits, revenue) .
- Use the second dropdown to choose which goals you want to include in the graph (you can check or uncheck goals).
- Use the third dropdown to select the timescale for the data you want to analyze.
To hide the graph, click Hide graph.
Graph controls
Select area
To focus on a specific area of data:
- Click the Select area icon.

- Click and drag over the chart to select the desired area.
- Click the checkmark to confirm your selection.
The chart will now display the selected area.
Zooming and resetting
- Click + to zoom in on the chart.
- Click – to zoom out.
Click the Reset icon to reset your view of the chart.
