
Kameleoon gives you access to certain key data in the Audiences section of the App. Learn how to configure this option to access it!
Access to Key data
To access the Key data of one of your projects, navigate to the Audiences page. Depending on your subscription and configuration, you will encounter one of these scenarios:
- You subscribed to the Premium version of AI Opportunity Detection & Audiences is configured on your project: If you have the premium version of the AI Opportunity add-on and have set up Audiences for your project, you can access enhanced data insights directly on this page.
- You subscribed to the Premium version of AI Opportunity Detection but Audiences is not configured on your project: If you have the premium AI Opportunity Detection add-on but haven’t configured a main goal for your project yet, you’ll need to set up a main KPI in the audiences configuration section to start receiving detailed data insights.
- You did not subscribed to the Premium version of AI Opportunity Detection: You can still access global KPI giving you insight on your experimentation strategy without the premium AI Opportunity Detection add-on but your access to certain data insights through the Audiences page will be limited. Make sure you have set up a main goal to unlock these data. The freemium version also includes a credit of 3 opportunities, allowing you to unlock valuable insights for the experiments of your choice.

The Key data section, located at the top of the page, is accessible to all users. Simply click on the Configure button and follow the steps.

The Audiences Analysis section, found at the bottom of the page, is only available to Premium users. For more information about this feature, please contact your Kameleoon Customer Success Manager.
Understand your Key data and performance metrics
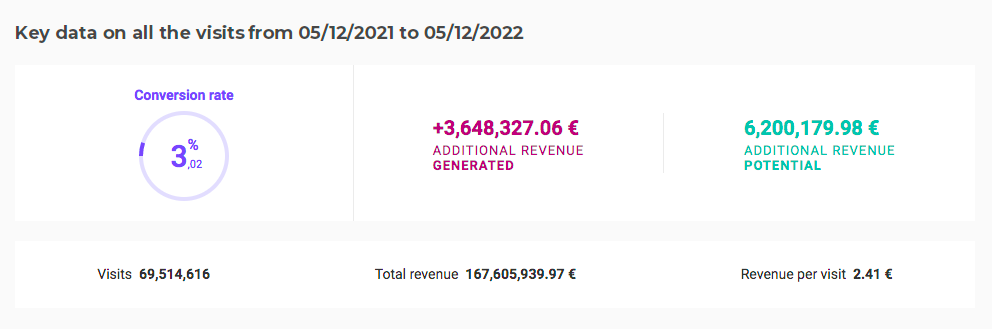
The key information block presents data about the performance of your experiment program for the last 12 months. These figures are based on your website / app main goal. For additional revenue computations, we use all the campaigns which ran over the period and were configured to track the audience main goal. We require that they targeted a minimal number of visits to be included in the computations.
The additional revenue figures are computed with the assumption that there were no interferences between the campaigns and in this context, the winning variation is the one that generated the most revenue per visit.
Average conversion rate
It is the average conversion rate among the visits included in the audience.
Additional revenue generated
Additional revenue generated is the extra turnover you brought in using Kameleoon measured on your test data. It is the additional income that was generated by the winning variations of each of your Kameleoon campaigns, compared with the original.
It is calculated as follows:

Additional revenue potential
Additional revenue potential is the total turnover you could have generated over the period by diverting 100% of each campaign’s traffic to their winning variation.
It is calculated as follows:

Number of visits
It is the number of visits included in the audience.
Total revenue generated
Total revenue generated is all the turnover generated by all visits to your website.
Revenue per visit
Revenue per visit is the average revenue generated by each visit to your website.
It is calculated as follows:


