
A new version of the Graphic Editor is currently being deployed, this documentation will be updated soon.
In this article:
– A practical exercise to help you set up your first experiment
1. Imagine your experiment and identify your goals
We want to redesign the newsletter section on our blog’s home page.
Our goal is to increase newsletter subscriptions. So we will test several versions of this element of the home page.
A first hypothesis consists in revising the wording of the block. Another is to move it to another place on the page. We will test three versions of the page:
- Keep the block as it is (current situation);
- Change the wording of the block;
- Move the block to another place on the page.

2. Launch the Graphic editor
On the SnapEvent home page, use the keyboard shortcut Shift + F2 to launch the Kameleoon Graphic editor.
3. Create a new experiment
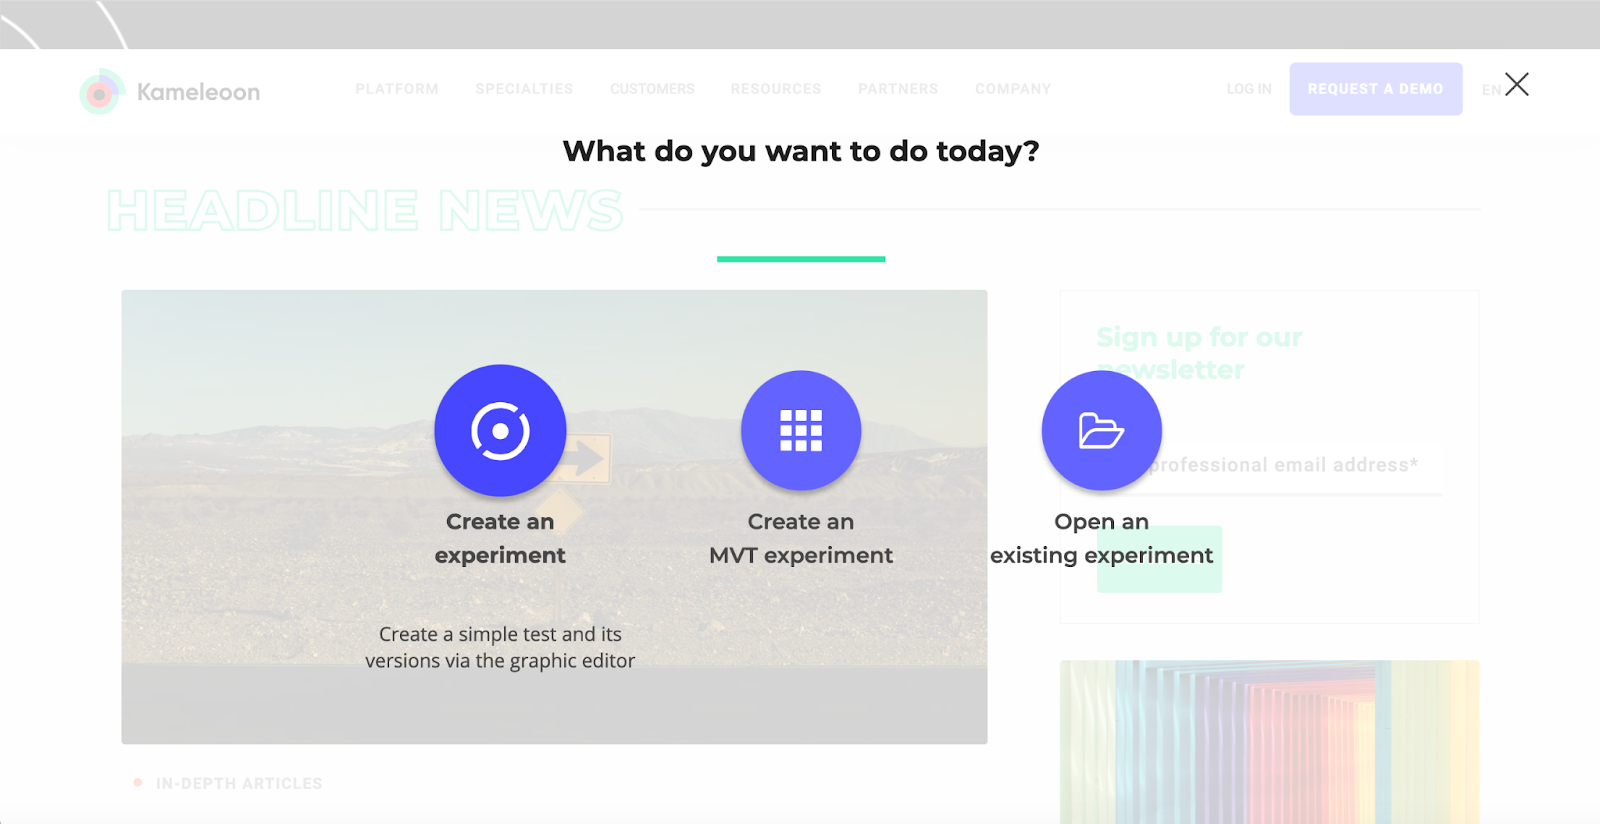
We click on Create an experiment to proceed.
We type in the name of our experiment and choose to give it a short description.
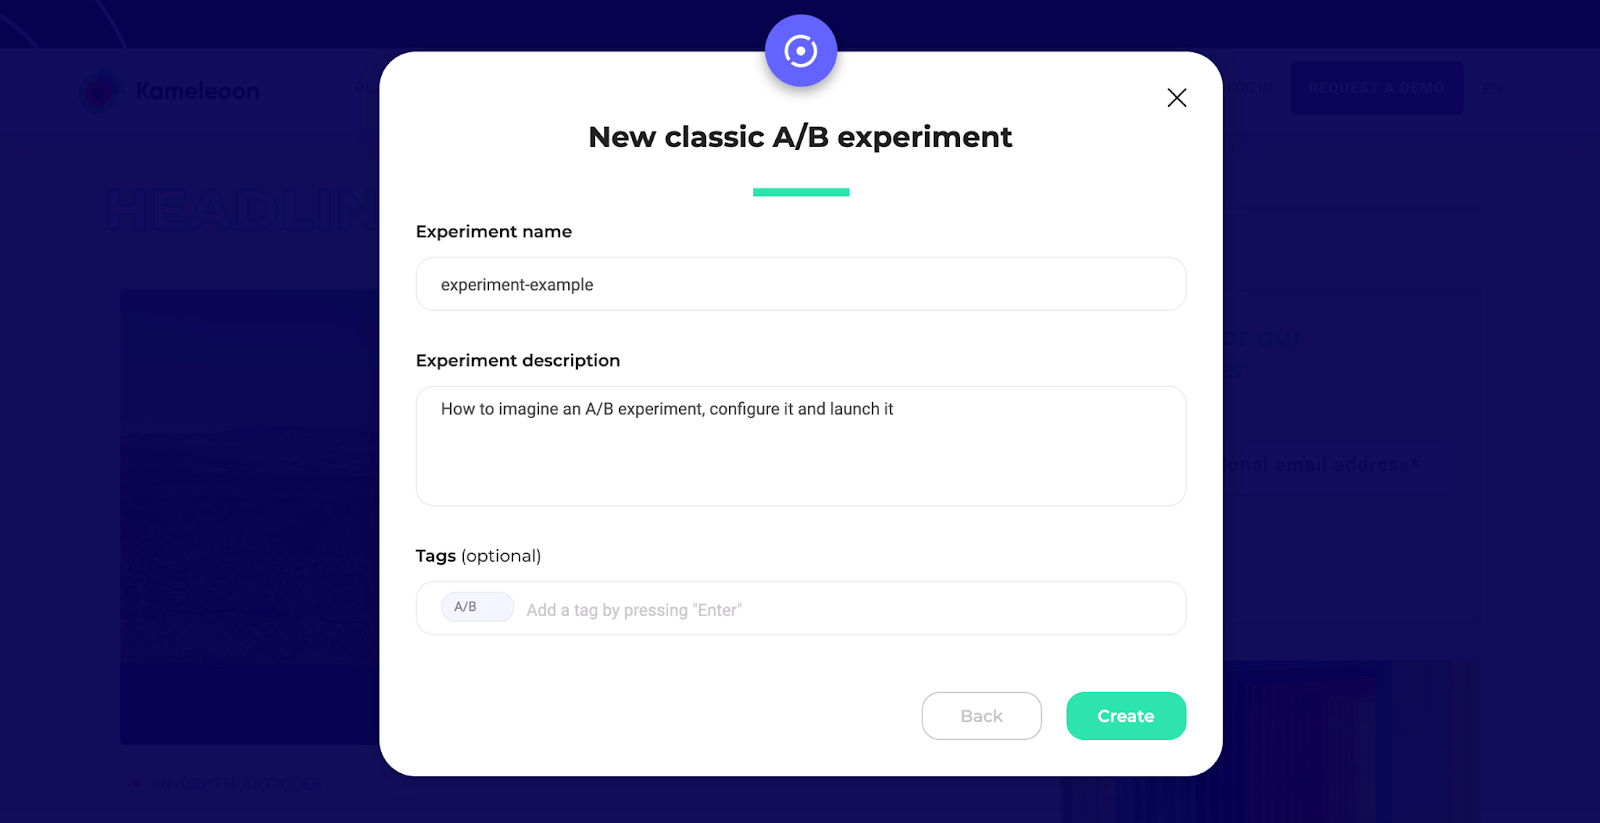
By clicking on Create, we validate these choices and access the Graphic editor.
4. Create variations
By default, there is already a first variation (Variation 1). We click on the variation to unfold the menu and access the modification actions.
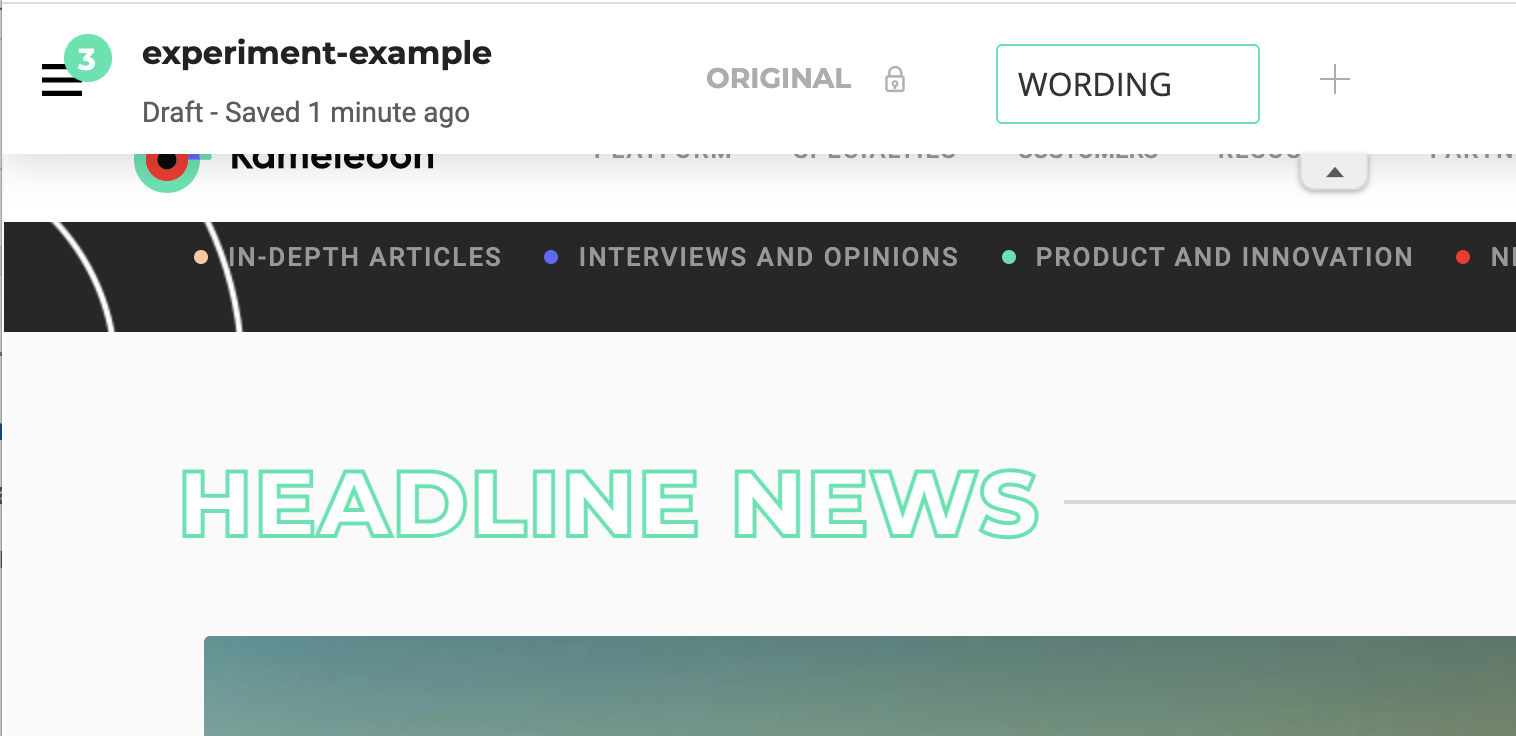
We rename the first variation to ‘WORDING’ since it involves modifying the wording.
In this variation, we are looking to replace “Sign up for our newsletter” with “Let’s stay in touch with our newsletter”
We select the block title to be edited, and the tool panel opens on the left of the editor.

We then click the Edit content option in the tool panel.

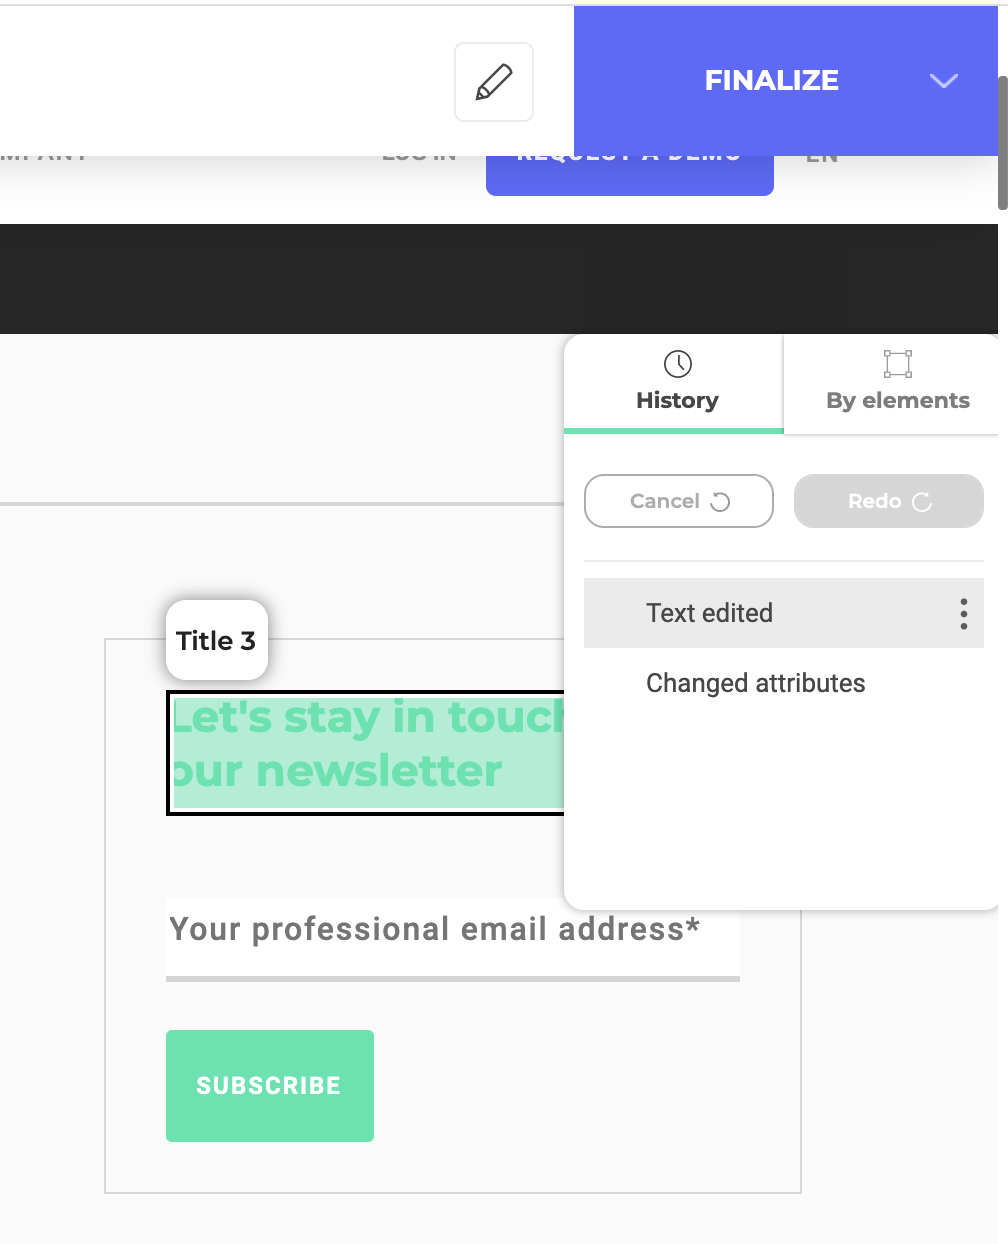
We enter the new text in the pop-up window while preserving the graphic charter’s style.
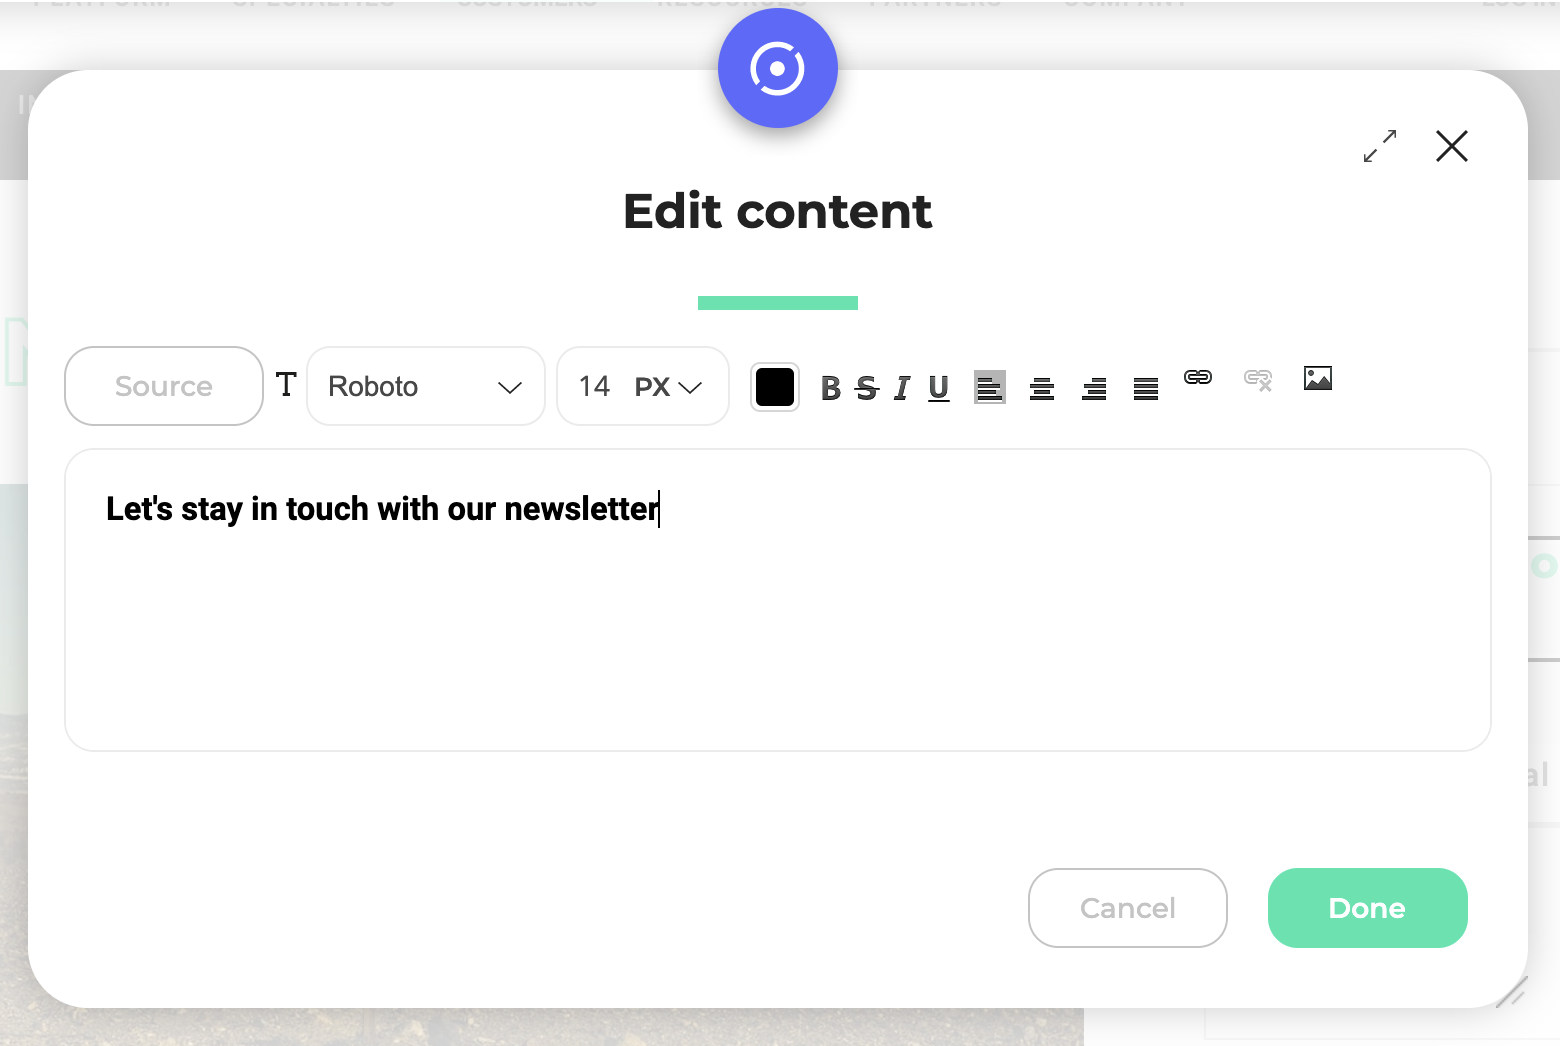
Once validated, the element is modified on the page.

If a mistake occurs, we can use the History tool located on the right of the editor to revert changes.
The modification we have just made is the first variation. In the second variation, the element will be moved on the page.
To add a new variation, we click on the + sign in the variation menu and rename it “POSITION”.
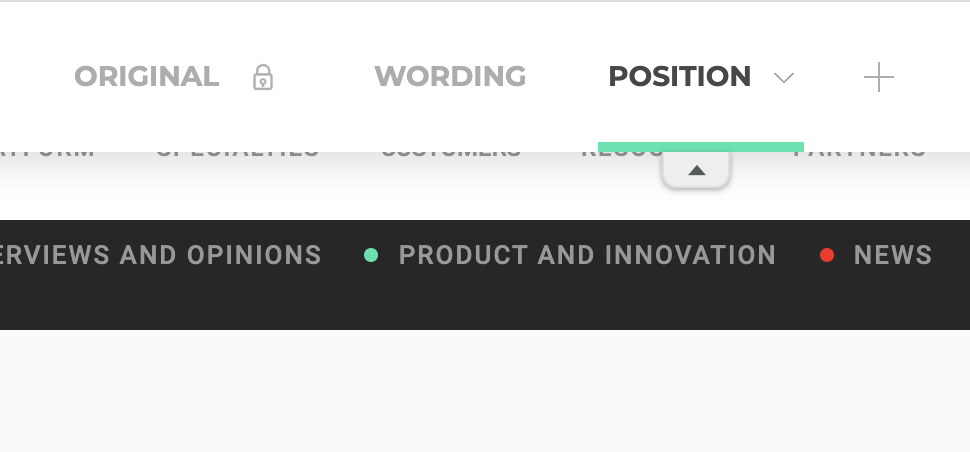
This time we will select the entire block and click on the Position tab of the tool panel.
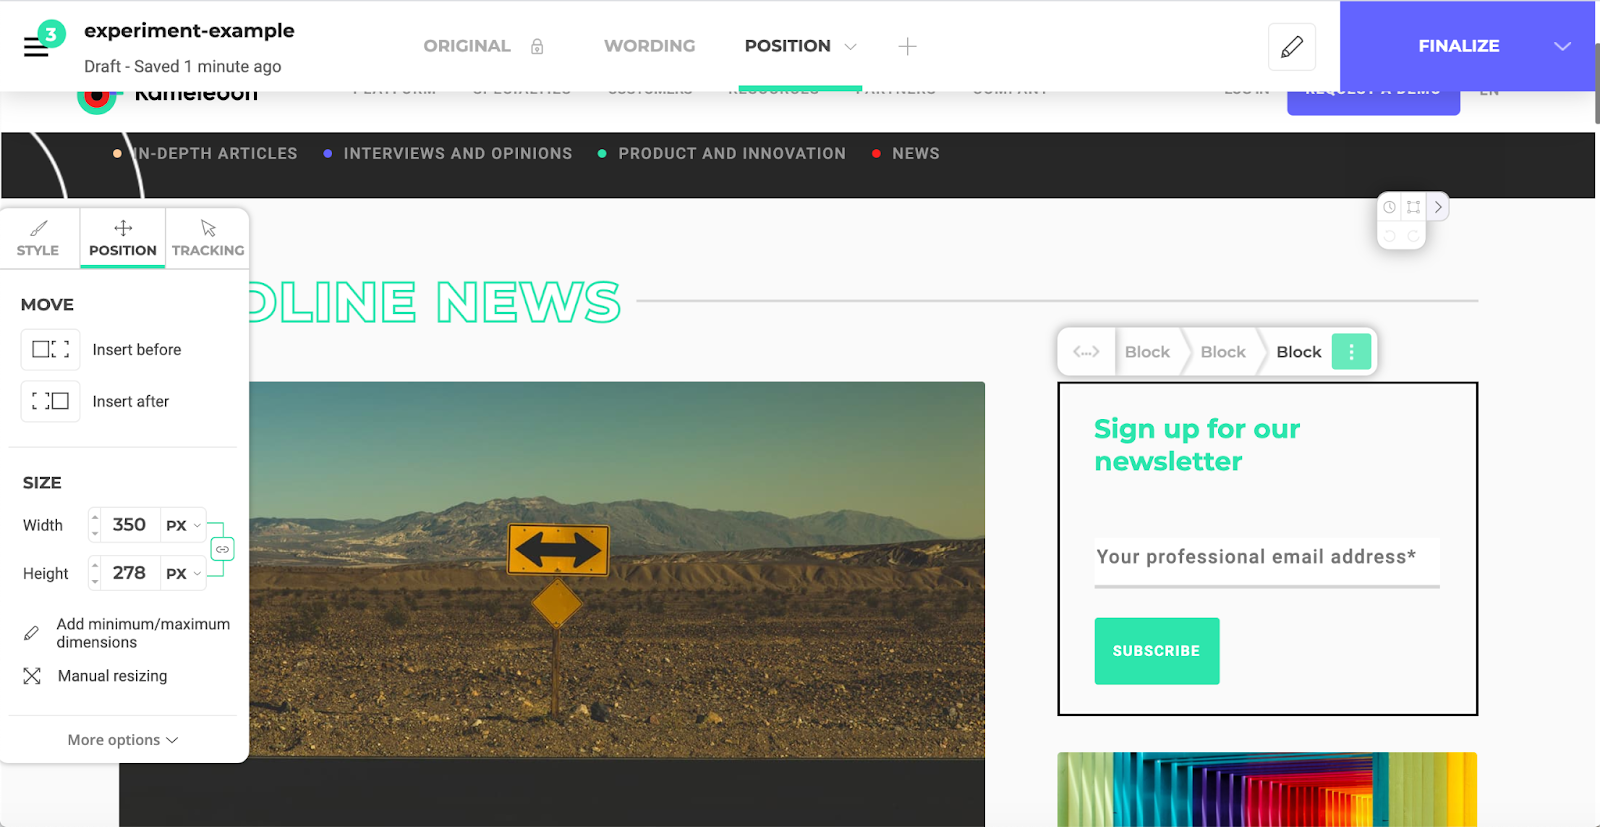
The move options allow us to position the element where we want.
We would like to place trackers on our element. For this, we select the Subscribe button in each variation and, in the Tracking tab of the tool panel, associate a click tracking to it.

It is then displayed in the lower part of the tool panel, under the heading Associated to the element: it has been taken into account.
There is no need to repeat the operation on the other variation: the tracking is associated with the element on the entire experiment.
We will use this tracking in step 8 of the exercise.
5. Target
Once the experiment variations are created, we enter the finalization phase.
By clicking on the Finalize menu at the top right of the editor, we can access the finalization page.

The first step of this finalization is to define the Targeting of the experiment (the conditions under which your visitors will be exposed to this experiment).

We are trying to attract returning visitors as a priority: we will target this population.
We click on Create a new segment.

In the Segment builder, we name our segment.

Then we drag and drop the New or returning visitors condition from the Visitor Characteristics category to the segment builder, and select only returning visitors.

We add another condition excluding smartphone users using the Device type condition. This means that only visitors meeting these criteria will be able to see our variations. All the others will only have access to the original version of our blog’s home page.

We click on Create to validate the creation of our segment.
Back to the finalization page, we select our segment to associate it to the experiment.

We just have to click on Next to go to the next step.
6. Distribute traffic
We need to distribute the traffic to our variations.
We click on Traffic distribution and adjust the percentage of visitors for each variation using the sliders.

We want to distribute the traffic between the original version of the page and the 2 variations we have just created. Half of the visitors will see the original; the other half will see one of the two variations.
To set up this distribution, we click on the padlock of the original to unlock the changes, then click on the percentage to the right and indicate 50. We enter the number 25 for each variation.

We then click on Next to go to the next step.
7. Associate a goal
We need to associate at least one goal so that it can track the performance of the variations and show results.
In step 4, we created a click tracking, which is then displayed as an option in the list of goals. We will select it by clicking on the corresponding line. It becomes the main goal of our experiment.

We then click on Next to validate this step.
We don’t need to indicate anything in the Integrations section: we can click on the Launch button.

8. Access the Configuration summary
A summary panel opens.

It’s now time to check that everything is ok:
- Traffic is allocated 50/50 between our two variations and the original one;
- The returning-visitors segment is targeted;
- The Kameleoon reporting tool is selected;
- Click tracking is associated with the experiment.
Each category can be scrolled to display the details.
We need to simulate our experiment to check our experiment setup. We click on Simulate at the bottom of the summary panel.
9. Simulate
A new page opens with the simulation panel.

In our example, we match all the targeting conditions: our status is Targeted. By clicking on the Targeting tab, we display all the conditions and our status in relation to them. Here, we are using a laptop: so the Device type condition that we defined in our segment is True. We are also a returning visitor: so this condition is True.
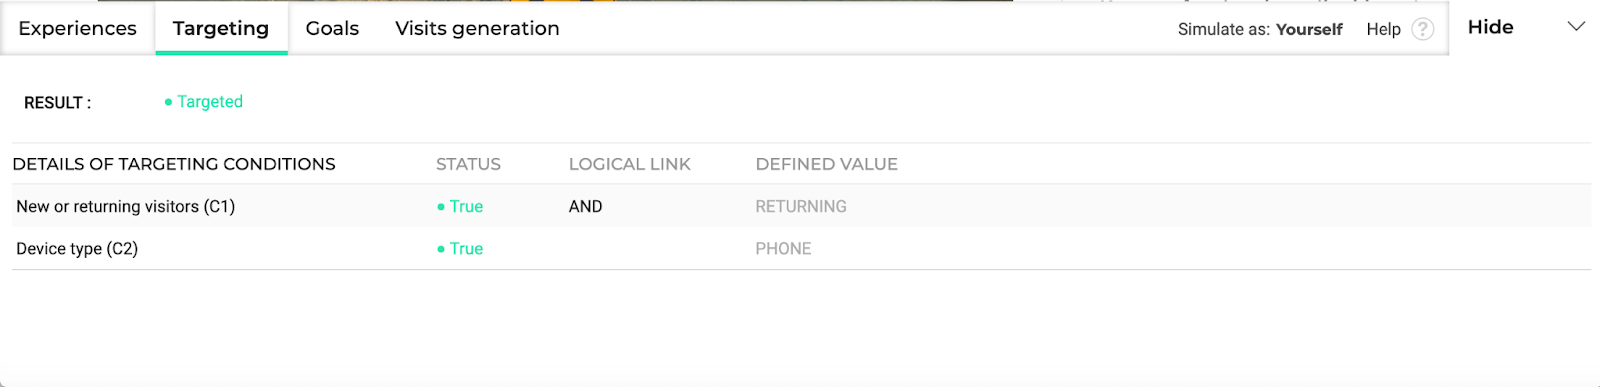
These elements enable us to check the targeting of our experiment. In our case, everything is working as expected.
The final stage: let’s make sure our goals are properly set. In the Goals tab of the simulation panel, the Achieved/Not achieved status of the goal is indicated (like for the True/False targeting conditions):

We have yet to click on the subscribe button for our variations. So it’s normal that associated click tracking hasn’t been achieved. All we have to do now is click on one of the elements and note that the status changes and becomes Converted: everything is fine!
We can exit the simulation by clicking on Close at the bottom right of the page.
10. Launch the experiment
Let’s go back to the Graphic editor. Our experiment is ready to go online. Click on Launch in the summary panel.

Note: There may be a short latency time (up to 10 minutes) between the launch of an experiment and its visibility on the website. So don’t worry if your experiment doesn’t appear immediately!
Depending on the daily traffic on our website, as well as our goals and the confidence rate that we want to achieve, we will have to wait for a certain amount of time before we can analyze the experiment results.
In this case, we will have waited five days. It would have been possible to estimate this duration thanks to the tool included in the finalization page of the editor (between the Simulate button and the Launch button).

If you are looking for more information, don’t hesitate to consult our Experimentation documentation and use the search bar.
