This is a premium feature. Please contact your Customer Success Manager to enable it on your Kameleoon Account.
Recommendation dashboard
In the product recommendation interface, click on Analytics > Dashboard.

Here you’ll find the performance of each of your recommendation blocks over time, so you can compare them.
The attribution window is 7 days. If users click on a recommended item and purchase it within 7 days, the purchase value will be included in the revenue.
The dashboard consists of a bar chart and a table.

The chart displays the evolution of your blocks’ performance over time. By default, the period analyzed is 14 days, but you can change this at the top right of the dashboard.
Hover your mouse over the bars of the chart to access detailed data for each block.

For each block, data is displayed in the table columns. (These data are defined in detail later in this article.)
This makes it easy to compare the performance of your various blocks.
Recommendation block performance
On your Recommender blocks dashboard, click on the name of a block to analyse its performance.

The first open tab is Performance.
By default, data are displayed for the last 14 days, but you can select any period in the dropdown at the top right of the page.

The page is divided between graphs and an Overview part on the right.
Overview
Here are the available data:
| Name | Description |
|---|---|
| Impressions | The total number of block impressions (a visitor can see the block more than once) |
| Unique impressions | Unique impressions are equal to the number of unique visitors |
| CTR | Percentage conversion rate from “Unique impressions” to “Unique clicks” |
| Clicks | Total number of clicks on products in the block |
| Unique clicks | Unique clicks are equal to the number of unique visitors |
| Added to cart | Total number of recommended products added to cart |
| Conversion | Percentage conversion rate from “Unique clicks” to “Purchases” |
| Purchases | The number of transactions made after navigating from the recommendation block to the product page. If a product is purchased twice in the same order, only 1 purchase will be counted. |
| Average order value | Revenue divided by the number of purchases |
| Revenue | Total revenue generated by this block |
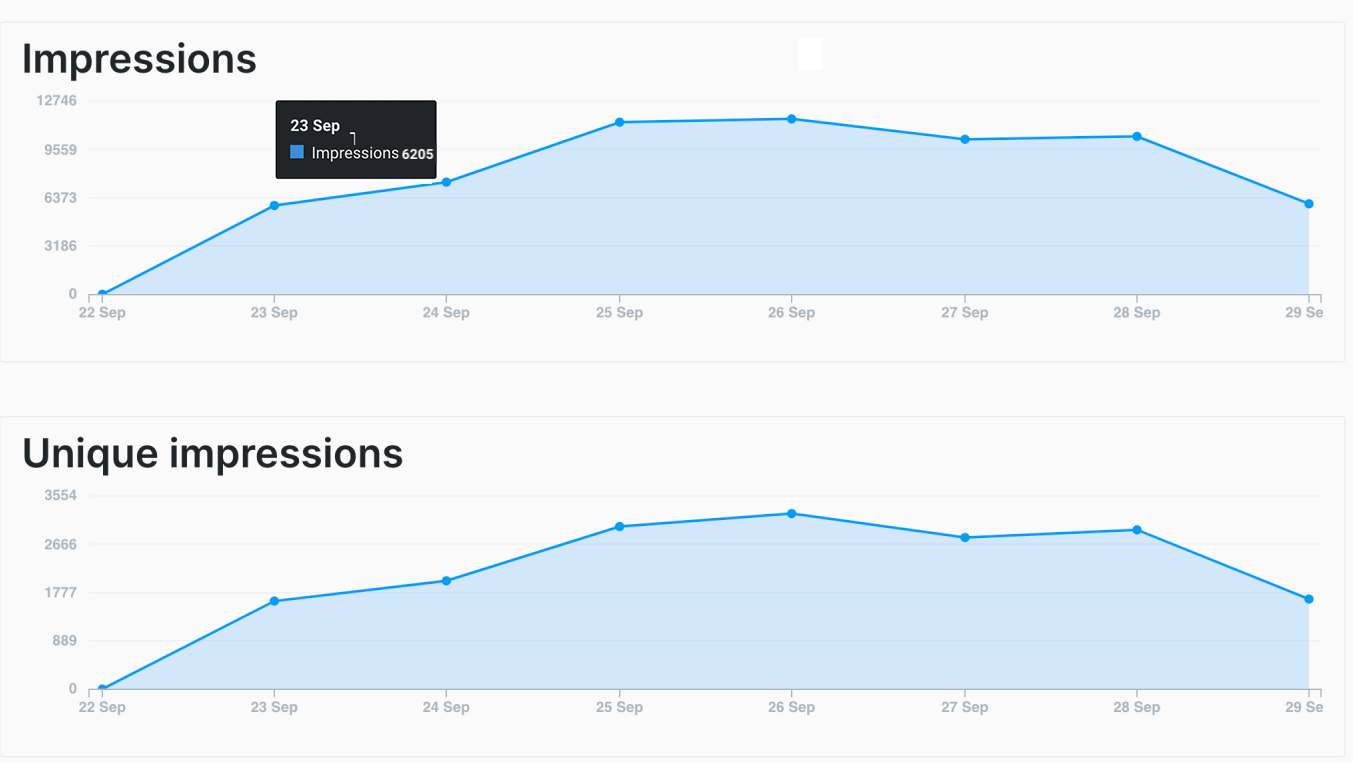
Graphs
Each graph displays an indicator for the selected period.
By hovering over the graph, you can see the indicator for each day of the selected period.
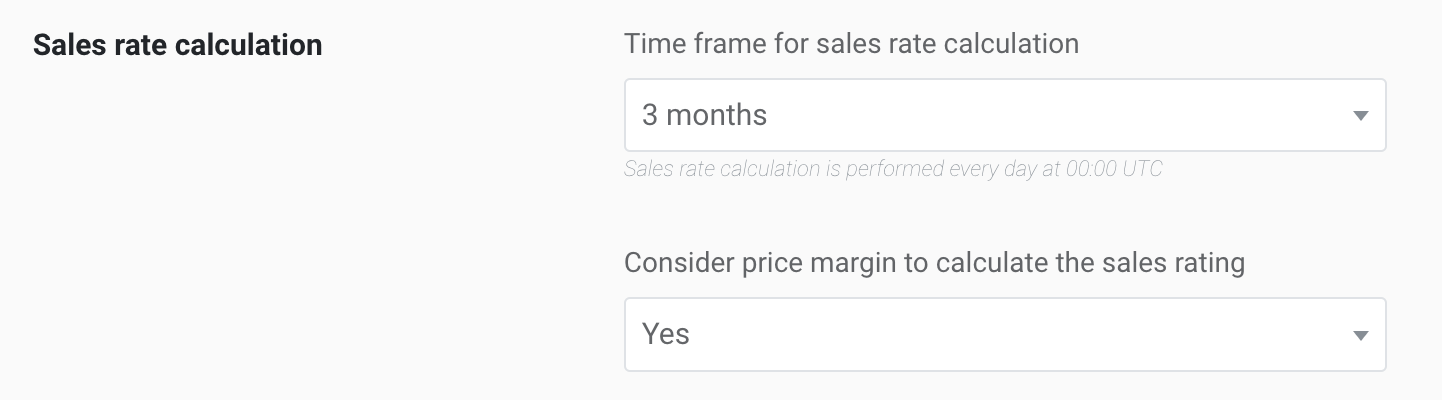
Sales rate
The sales rate measures a product’s value by considering purchases, price, and price margin (if enabled in your store settings).
The minimum possible rating is 1, even if the sales rate is zero, ensuring the product can still be ranked in the system. The maximum value is 300,000.
Each parameter in the sales rate calculation is assigned a weight coefficient:
- Number of purchases: 1.0 (key factor)
- Price margin: 0.8
- Price: 0.05
Note: If the price margin parameter is disabled, the rating is based solely on normalized sales volume data and price.
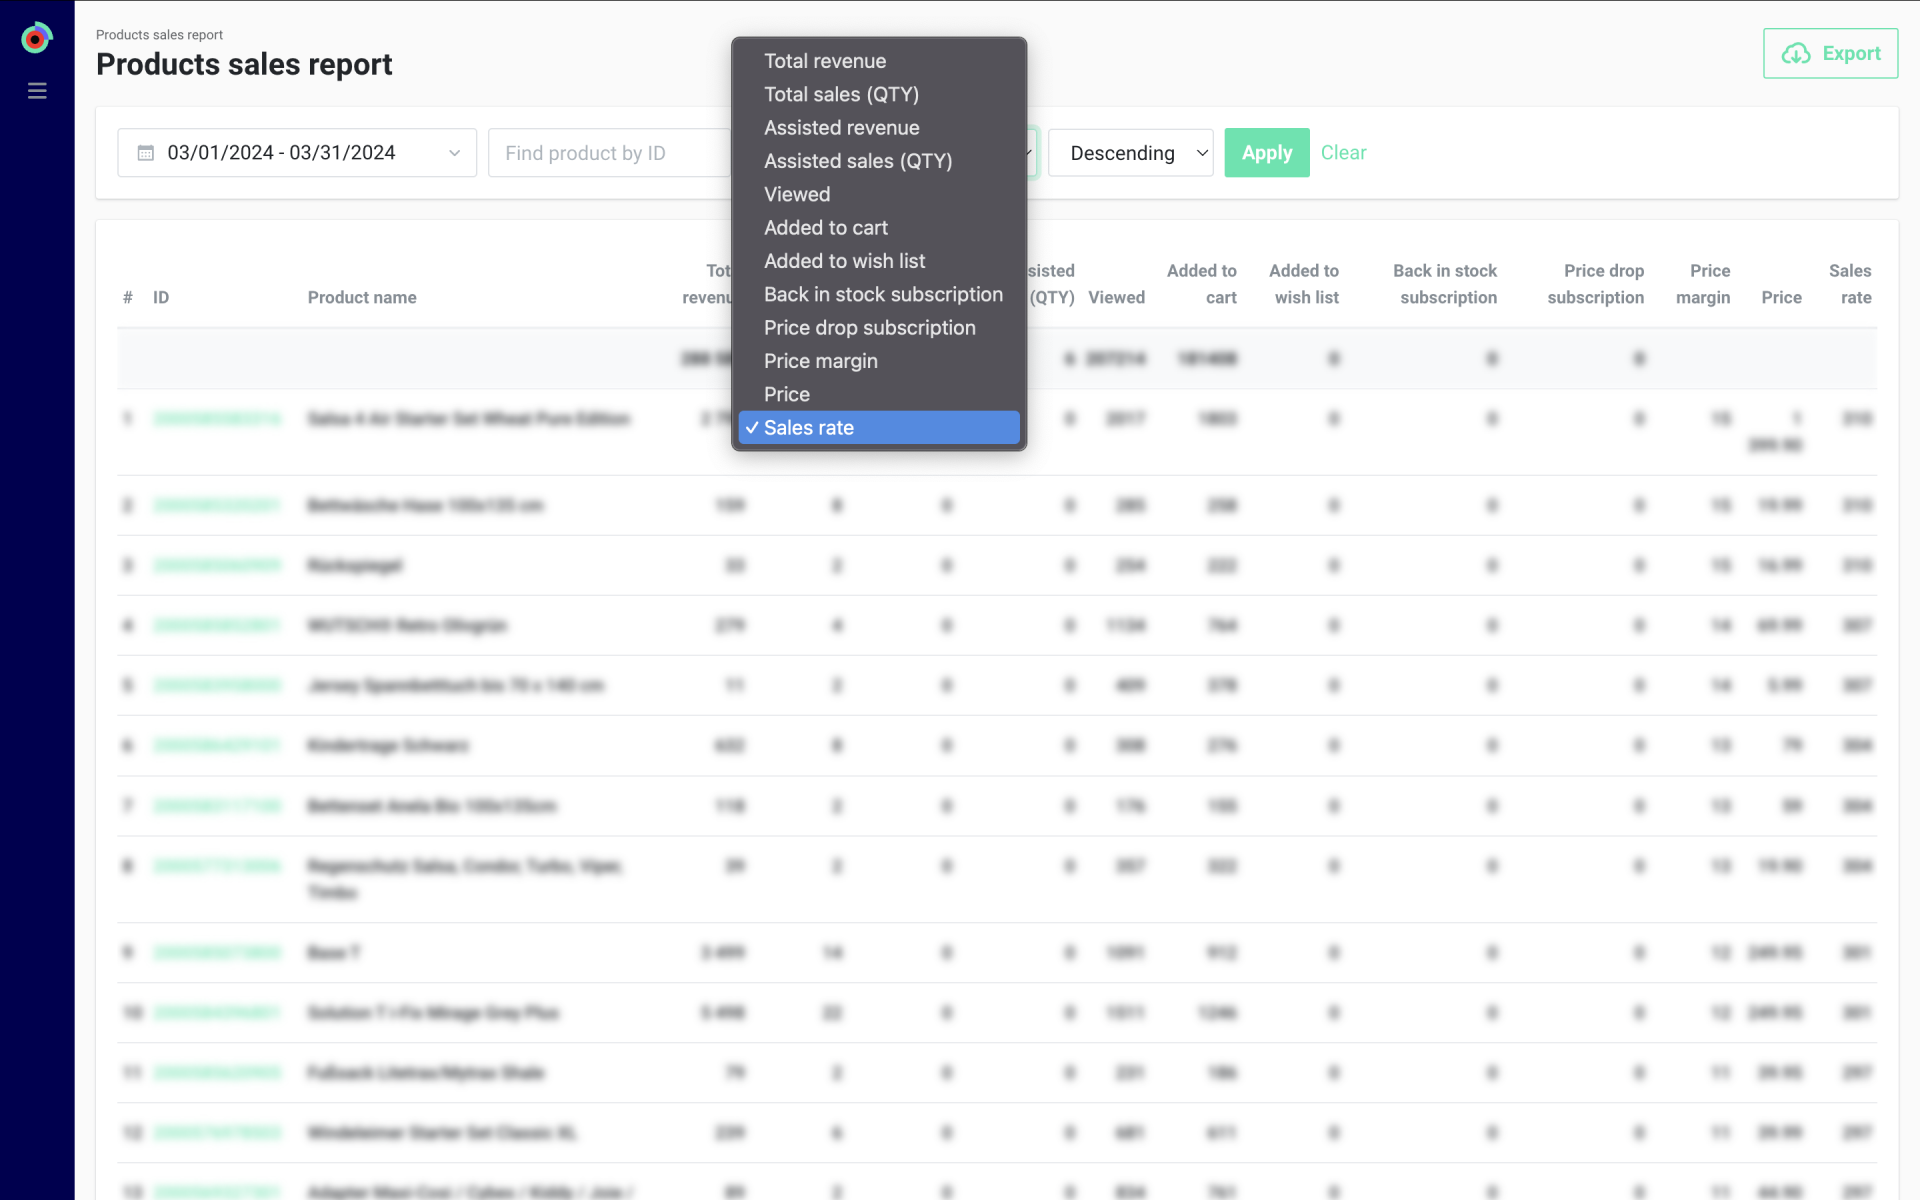
You can adjust the time frame for its calculation in Settings > Store Settings.
In Analytics > Product Sales, you can list all the products based on their sales rate.