
The Feature Experimentation dashboard has been redesigned. It now centralizes project, environment, and flag management into a clearer layout. This article outlines the new dashboard sections and how to use them.
Dashboard structure
Tabs
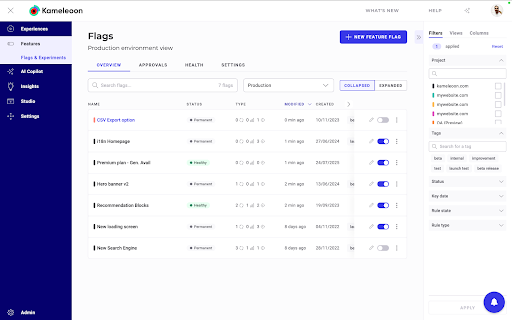
The dashboard is organized into three main tabs:
- Overview: The standard view, which lets you navigate your flags and their rules.
- Approvals: Lists flags or rules waiting for approval before rollout.
- Health: Displays flag health, last evaluation, and last modification to better manage technical debt.
- Settings: Access to approval and holdout settings. You can access holdout reporting from this tab.
Environment selector and views
At the top of the list of flags, you can switch between your projects’ environments or use the new All environments view to see a consolidated view.
You can also adjust how flags are displayed with the view toggle:
- Collapsed: Compact list of all flags, similar to the previous dashboard.
- Expanded: Shows details at a rule-level for a more complete picture of the rollouts and experiment in your flag’s environments.
Flag actions
From the dashboard list, you can also:
- Toggle a flag On or Off.
- Open the flag configuration using the edit icon.
- Click the edit or results icon at the end of a rule’s row to open its configuration or reporting page.