You launched your experiment a few hours ago but still do not visualize any statistics on your reporting tool (Kameleoon, Universal Anaytics…)? You can follow this guide to make sure your experiment is set up properly.
Kameleoon
With Kameleoon reporting tool, results are sent in real time by default. However, Kameleoon will show you these results only if there is enough visits and conversions (above around 100 visits and 60 conversions).
Universal Analytics
Check your reporting tool configuration
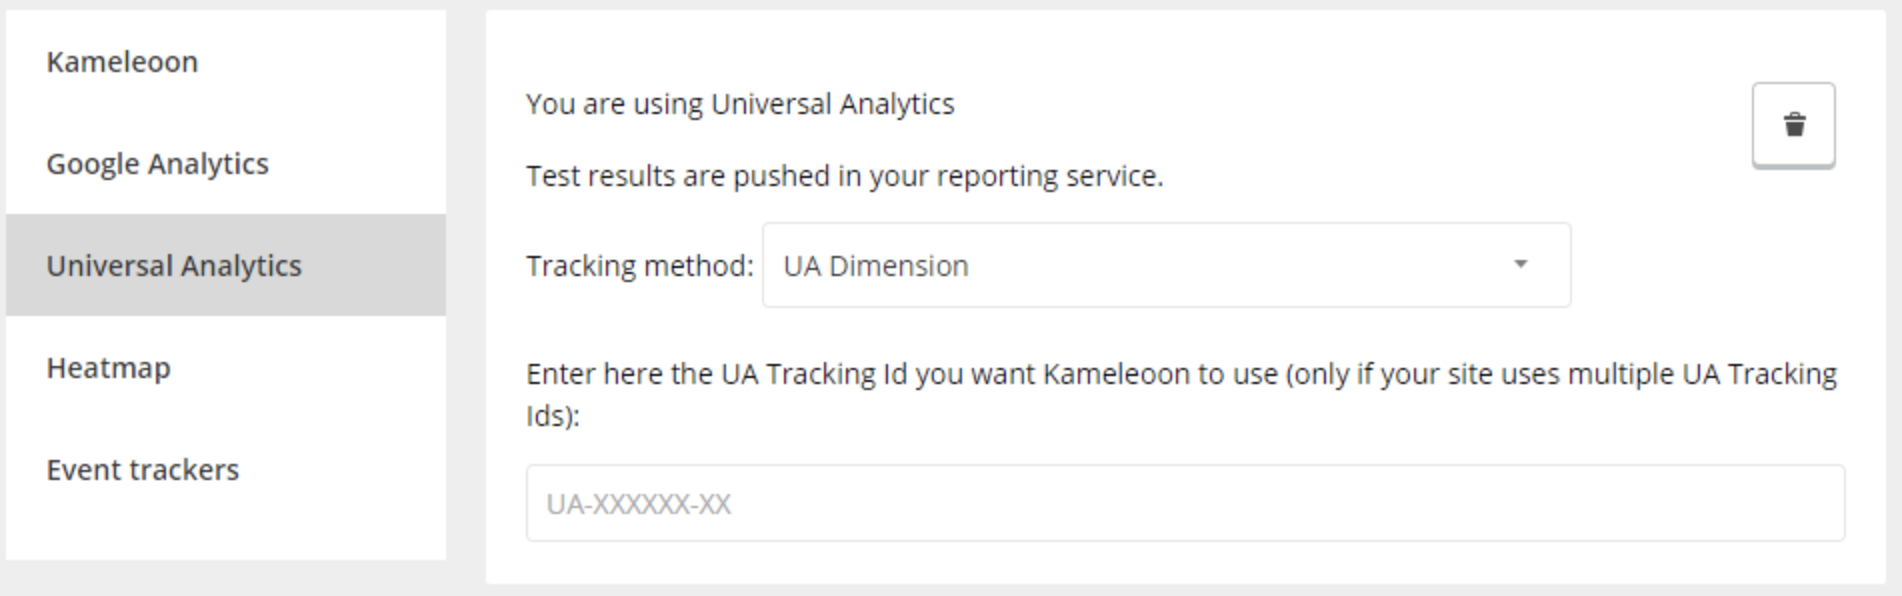
Universal Analytics is the latest version of Google Analytics. However, both solutions are technically different and you must activate the right tool when you set up your reporting tool in Kameleoon.
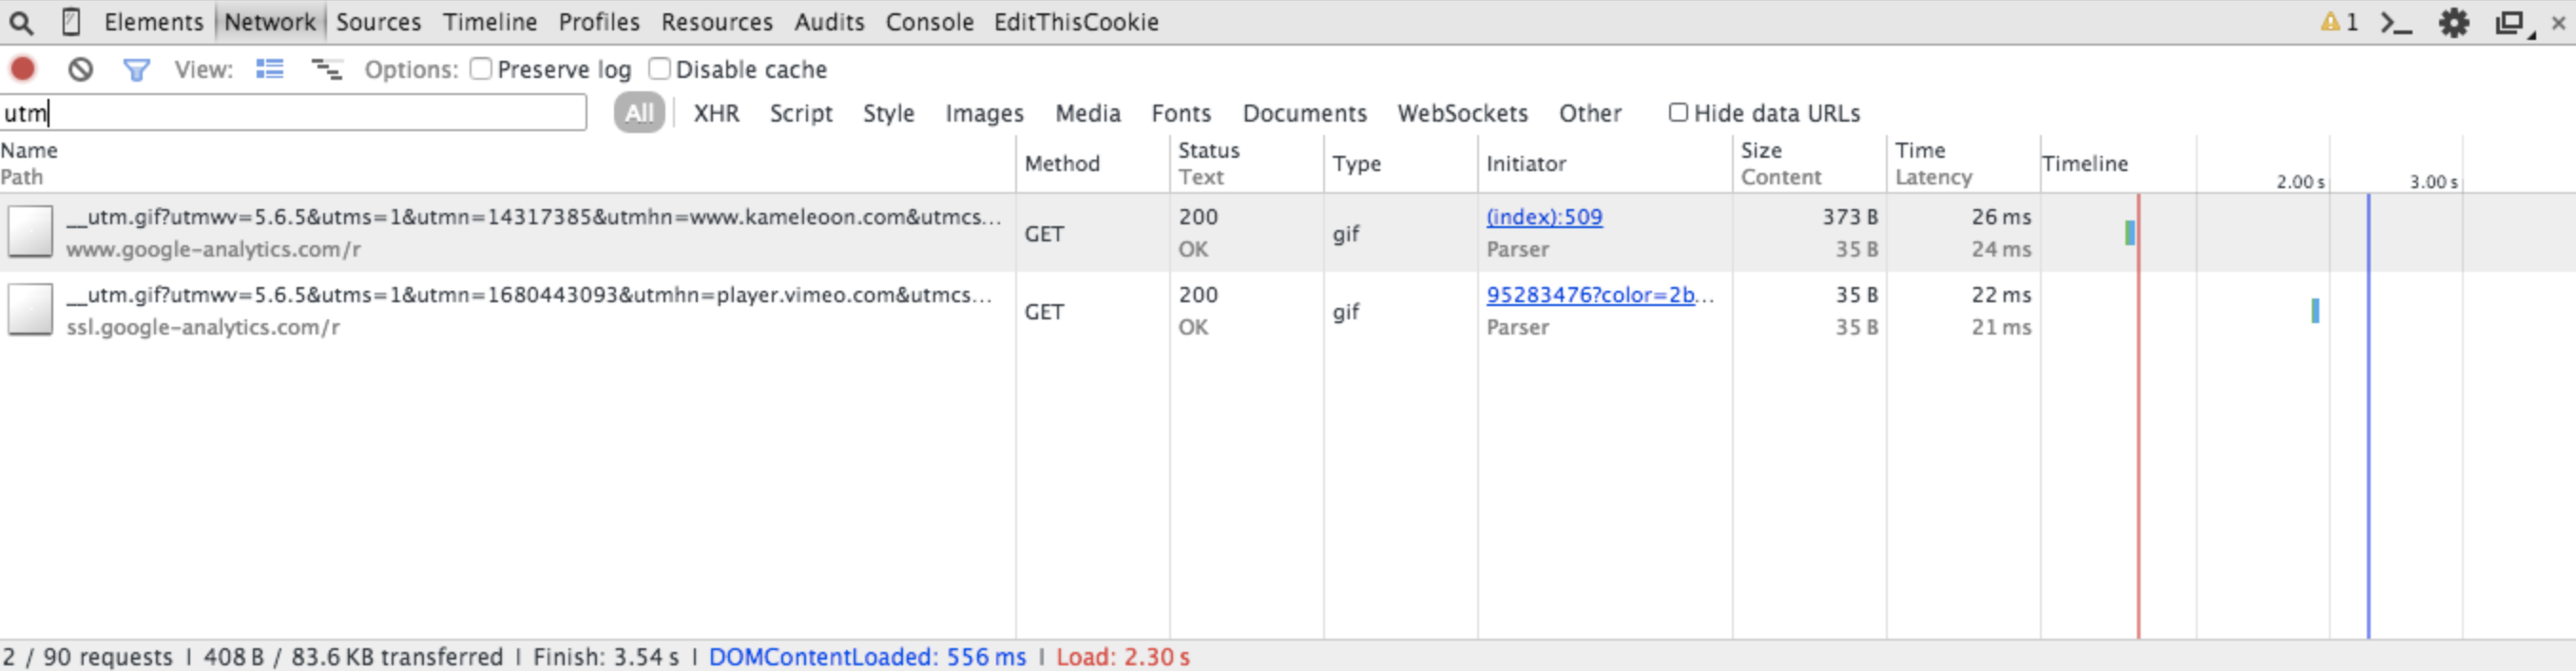
To know if you are using Google Analytics or Universal Analytics, you can open a web console in your browser (with F12 on a PC or CMD+ALT+I on a Mac). Then, click on the “Network” tab and look for the “utm” information in the filter zone to know if Google Analytics is used or “collect” if it is Universal Analytics.
Then, check if the right reporting tool was chosen on your experiment.
Warning: For Universal Analytics, you must have previously declared a custom dimension, or there will be no Experiment data available. For further information, you can read our article Setting up Universal Analytics (ex Google Analytics).
Check if the “utm” call (Google Analytics) or “collect” call (Universal Analytics) contains the Experiment data
If Kameleoon loads before Google Analytics, the A/B experiment data are sent with the standard page view call. If Kameleoon loads after, the data are sent with a type “Event” call.
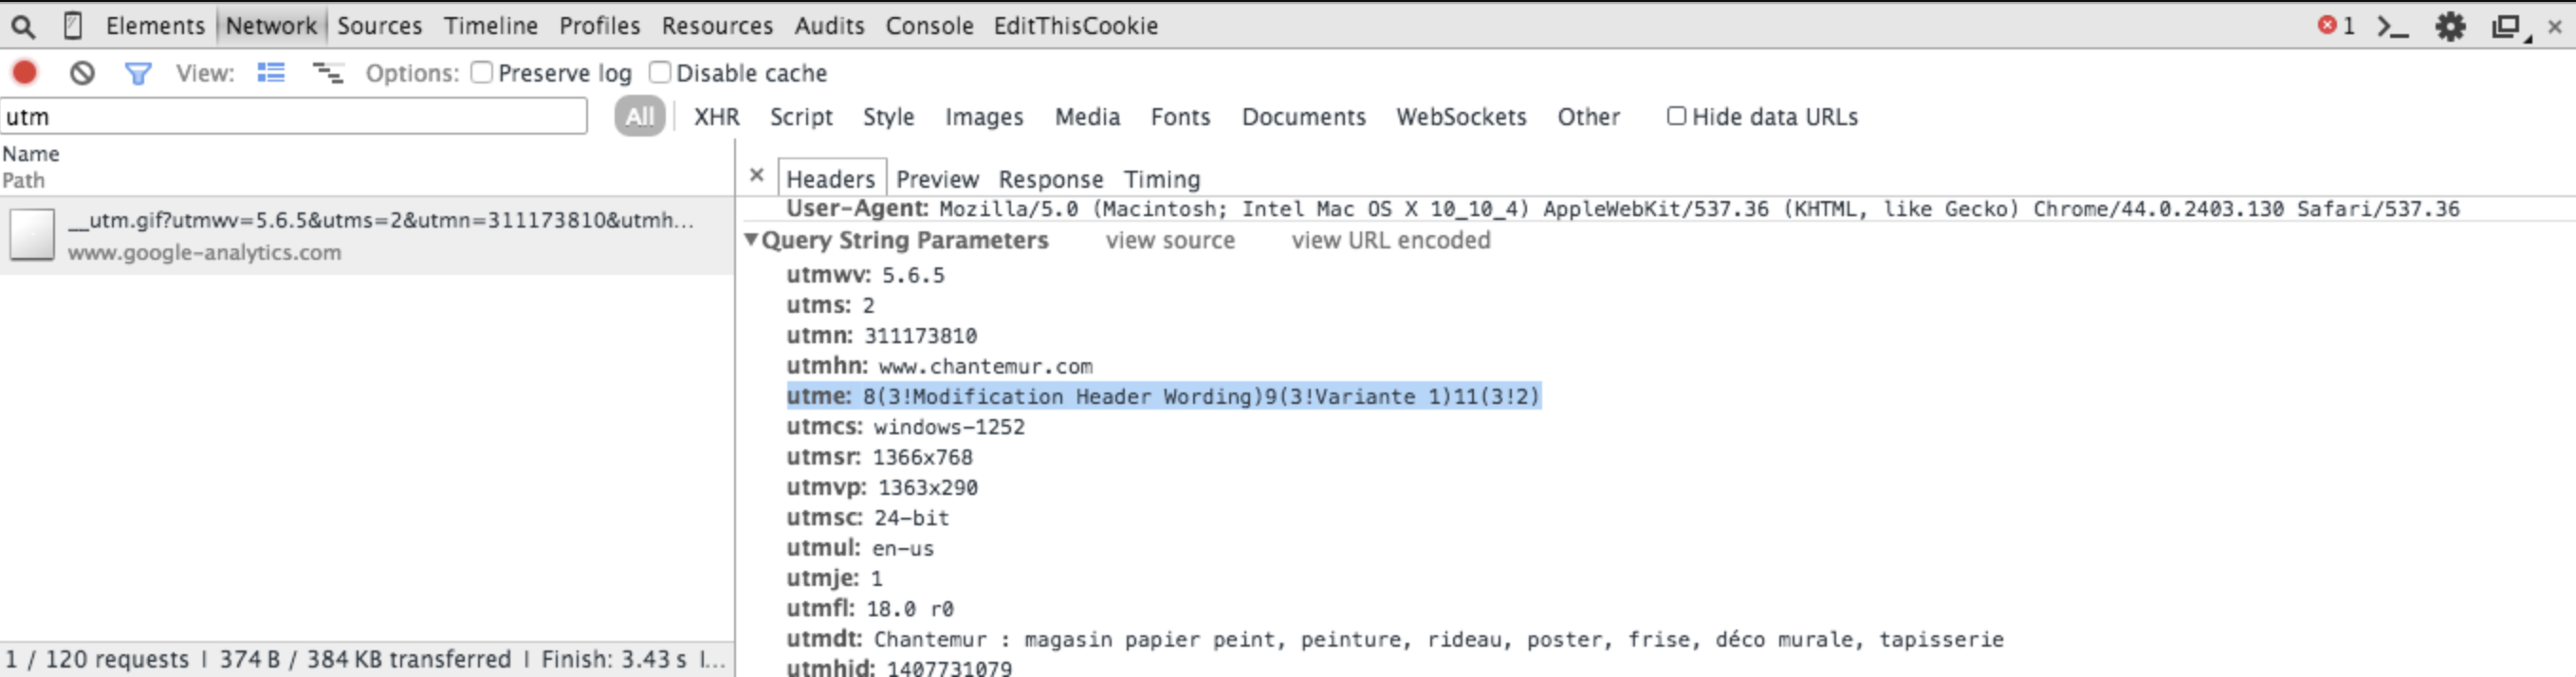
With Google Analytics, the information you must look for is “utm”. It contains the name of the experiment and the name of the variation displayed. In the example below, one experiment is running on this website: Modification Header Wording and the variation displayed is Variante 1.
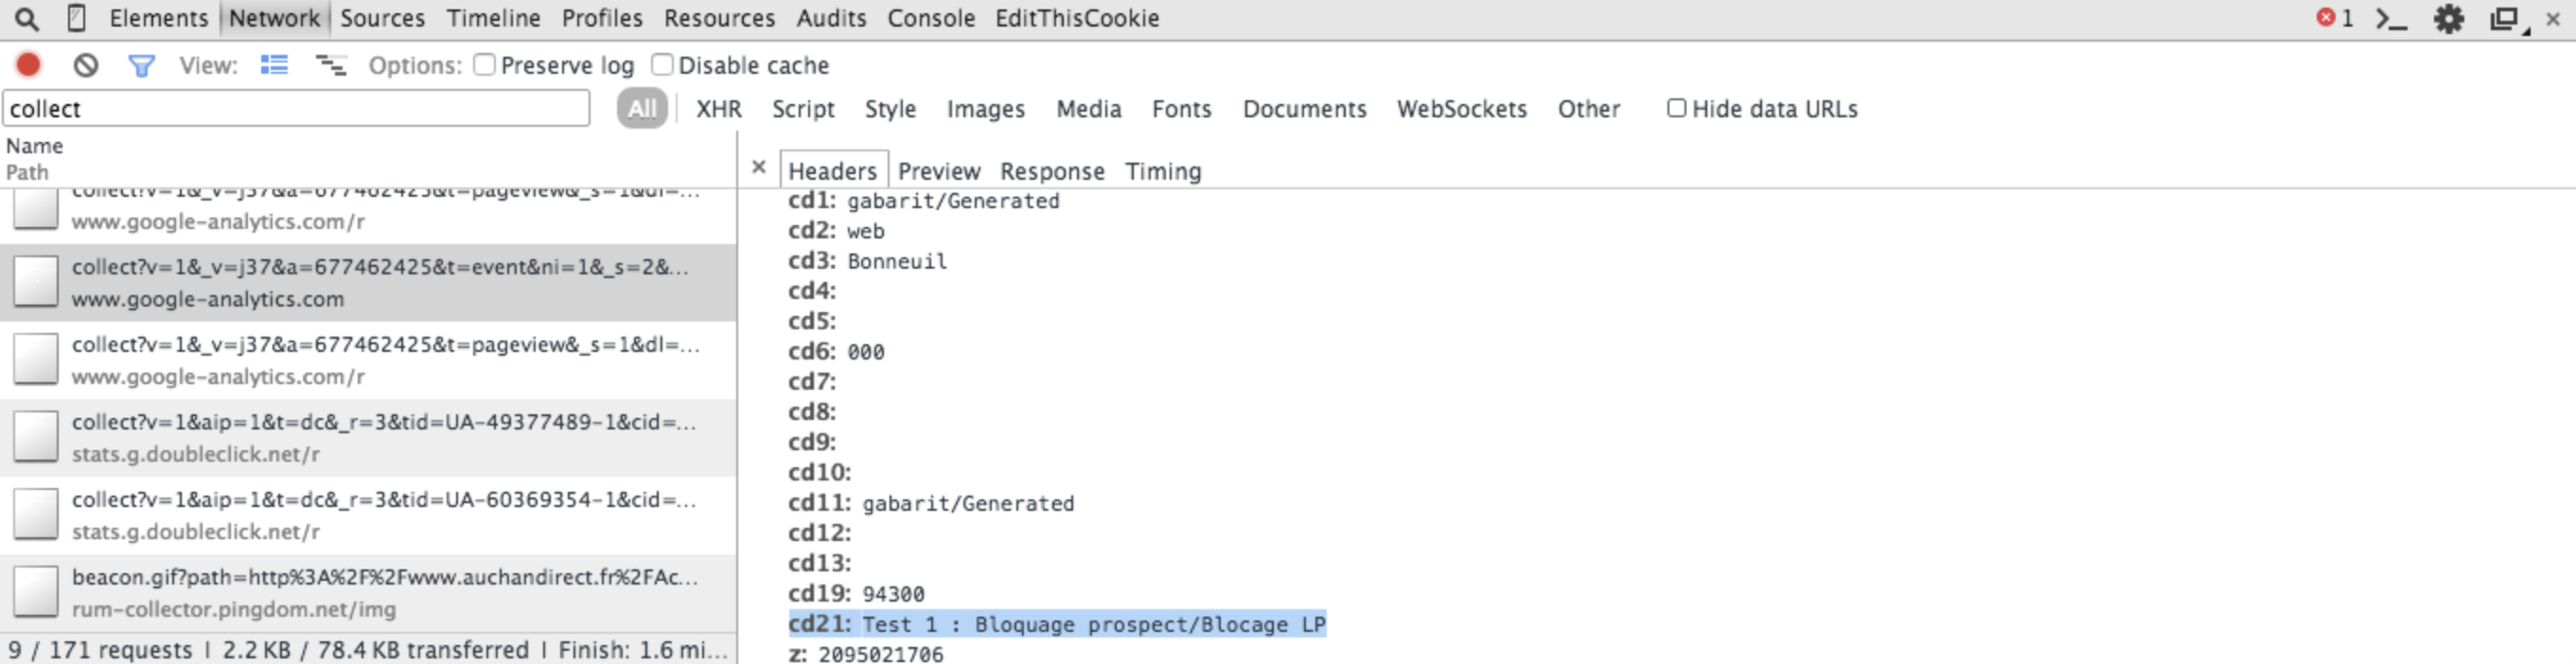
With Universal Analytics, the Experiment data are in the custom dimension you chose when you launched your experiment. In the example below, the custom dimension is “CD21”, the name of the experiment is Test 1 : Bloquage prospect and the displayed variation is Blocage LP.
If you cannot find any data, your configuration might not be correct.
Check the name of Google Analytics tracker
Sometimes, the name of Google Analytics tracker might have been customized by your CIO. In this case, you must indicate to Kameleoon which name will be used to send the Experiment data. To do this, open a web console in your browser and type in: window._gat._getTrackers()[0]._getName(). In the example below, the name of Google Analytics tracker is secondTracker.

Note: Sometimes, several trackers are available on your website if several Google Analytics are active on your website. To know if it is the case, type in the command
window._gat._getTrackers().length. If the command returns more than one result, it means that several Google Analytics are used. In this case, please contact your CIO or Kameleoon to help you with your configuration.
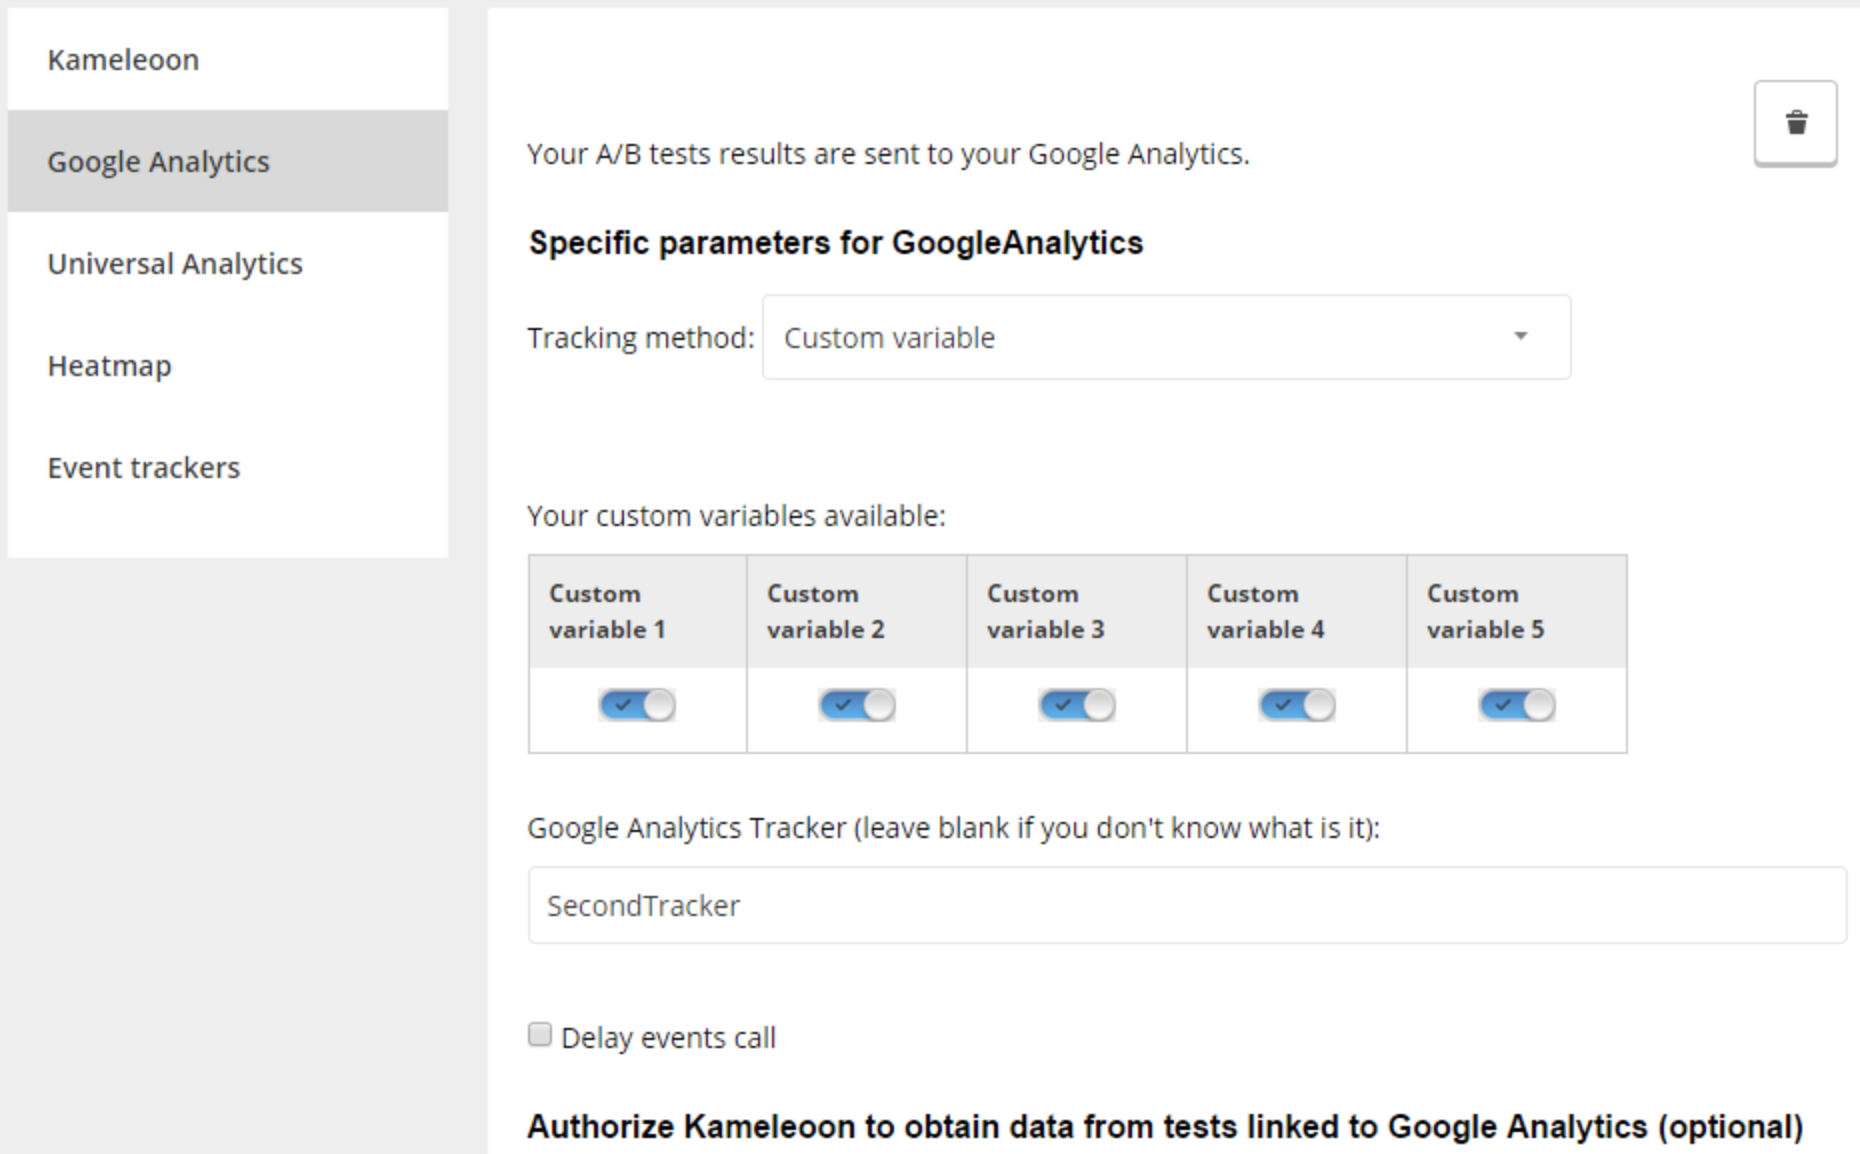
If the tracker code is not the one by default (usually, the command window._gat._getTrackers()[0]._getName() returns an empty chain of characters), you have to set up the right tracker name to send the Experiment data in Google Analytics. To do this, go to the reporting tools parameters in your Kameleoon account.
For Universal Analytics, it can be necessary to specify the ID of Universal Analytics view, if, for example, several Universal Analytics are used on the same website. You can find this ID on the “Admin” page.
AT Internet
AT Internet works similarly to Google Analytics. When Kameleoon loads before AT Internet, A/B experiment data are sent with the standard page view call. If Kameleoon loads after, the data are sent with an MVT call, using the function called xt_mvt. In most cases, this function must be located in the xtcore.js folder (AT Internet file). To know if this function is available on your website, open a web console in your browser and type in the command xt_mvt. If an error occur, this function is not available. Your AT Internet file has to be updated by your CIO as the function xt_mvt is automatically available with the xtcore.js file in the latest versions.
Adobe Analytics (Ex Omniture Site Catalyst)
Omniture works similarly to Google Analytics. When Kameleoon loads before Omniture, the A/B experiment data are sent with the standard page view call. If Kameleoon loads after, the data are sent with an “Event” type call. If you are using the plugin doPlugins on your website, please read this article from our developers documentation, which indicates the JavaScript code lines that you must add to the variable in order to push your experiment results in Adobe Analytics.